Ghidra Plugin Development for Vulnerability Research - Part-1

Overview

On March 5th at the RSA security conference, the National Security Agency (NSA) released a reverse engineering tool called Ghidra. Similar to IDA Pro, Ghidra is a disassembler and decompiler with many powerful features (e.g., plugin support, graph views, cross references, syntax highlighting, etc.). Although Ghidra's plugin capabilities are powerful, there is little information published on its full capabilities.  This blog post series will focus on Ghidra’s plugin development and how it can be used to help identify software vulnerabilities.

In our previous post, we leveraged IDA Pro’s plugin functionality to identify sinks (potentially vulnerable functions or programming syntax).  We then improved upon this technique in our follow up blog post to identify inline strcpy calls and identified a buffer overflow in Microsoft Office. In this post, we will use similar techniques with Ghidra’s plugin feature to identify sinks in CoreFTPServer v1.2 build 505.

Ghidra Plugin Fundamentals

Before we begin, we recommend going through the example Ghidra plugin scripts and the front page of the API documentation to understand the basics of writing a plugin. (Help -> Ghidra API Help)

When a Ghidra plugin script runs, the current state of the program will be handled by the following five objects:

  • currentProgram: the active program

  • currentAddress: the address of the current cursor location in the tool

  • currentLocation: the program location of the current cursor location in the tool, or null if no program location exists

  • currentSelection: the current selection in the tool, or null if no selection exists

  • currentHighlight: the current highlight in the tool, or null if no highlight exists

It is important to note that Ghidra is written in Java, and its plugins can be written in Java or Jython. For the purposes of this post, we will be writing a plugin in Jython. There are three ways to use Ghidra’s Jython API:

  • Using Python IDE (similar to IDA Python console):

  • Loading a script from the script manager:

  • Headless - Using Ghidra without a GUI:

ghidra_output4.png

With an understanding of Ghidra plugin basics, we can now dive deeper into the source code by utilizing the script manager (Right Click on the script -> Edit with Basic Editor)

The example plugin scripts are located under /path_to_ghidra/Ghidra/Features/Python/ghidra_scripts. (In the script manager, these are located under Examples/Python/):

ghidra_output6.png


Ghidra Plugin Sink Detection

In order to detect sinks, we first have to create a list of sinks that can be utilized by our plugin. For the purpose of this post, we will target the sinks that are known to produce buffer overflow vulnerabilities. These sinks can be found in various write-ups, books, and publications.

Our plugin will first identify all function calls in a program and check against our list of sinks to filter out the targets. For each sink, we will identify all of their parent functions and called addresses. By the end of this process, we will have a plugin that can map the calling functions to sinks, and therefore identify sinks that could result in a buffer overflow.

Locating Function Calls

There are various methods to determine whether a program contains sinks. We will be focusing on the below methods, and will discuss each in detail in the following sections:

  1. Linear Search - Iterate over the text section (executable section) of the binary and check the instruction operand against our predefined list of sinks.

  2. Cross References (Xrefs) - Utilize Ghidra’s built in identification of cross references and query the cross references to sinks.

Linear Search

The first method of locating all function calls in a program is to do a sequential search. While this method may not be the ideal search technique, it is a great way of demonstrating some of the features in Ghidra’s API.

Using the below code, we can print out all instructions in our program:

listing = currentProgram.getListing() #get a Listing interface
ins_list = listing.getInstructions(1) #get an Instruction iterator
while ins_list.hasNext():             #go through each instruction and print it out to the console
    ins = ins_list.next()
    print (ins)

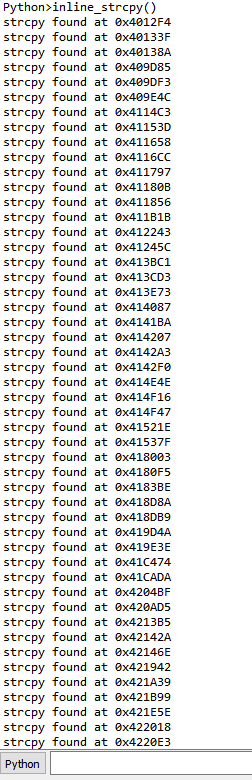
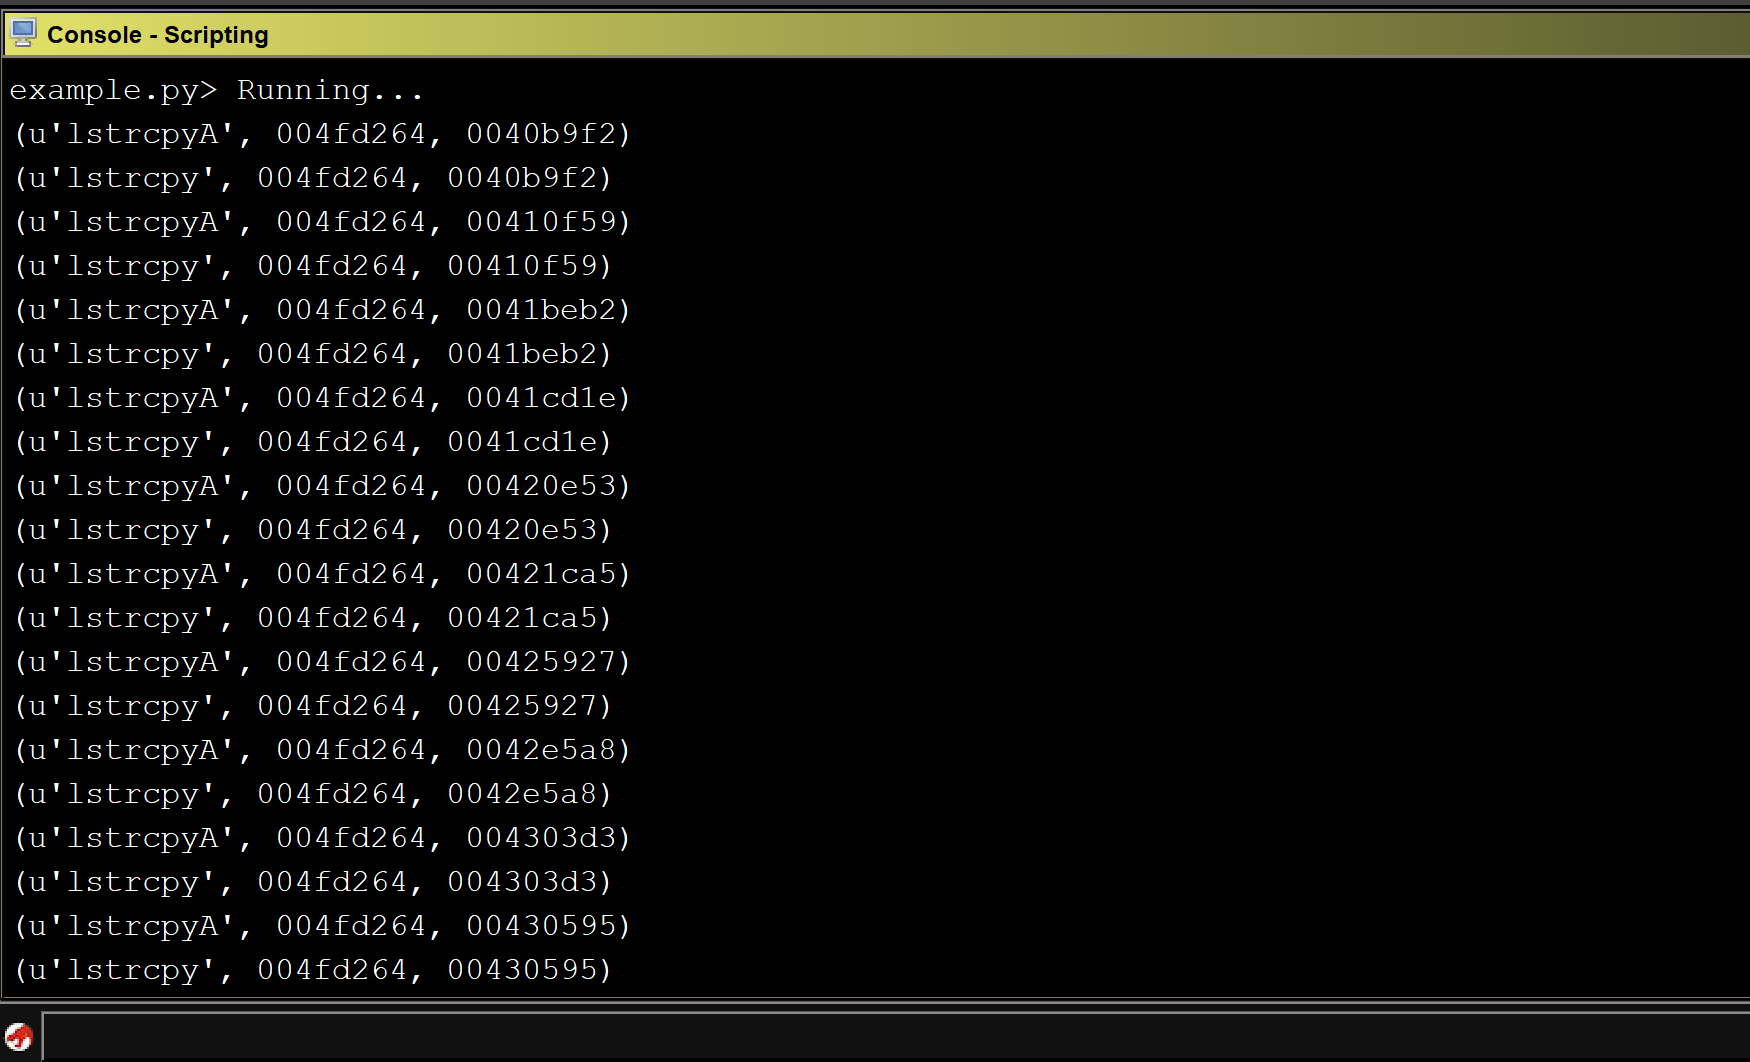
Running the above script on CoreFTPServer gives us the following output:

ghidra_output7.png

We can see that all of the x86 instructions in the program were printed out to the console.


Next, we filter for sinks that are utilized in the program. It is important to check for duplicates as there could be multiple references to the identified sinks.

Building upon the previous code, we now have the following:

sinks = [ 
         "strcpy",
         "memcpy",
         "gets",
         "memmove",
         "scanf",
         "lstrcpy",
         "strcpyW",
         #...
         ]
duplicate = []
listing = currentProgram.getListing() 
ins_list = listing.getInstructions(1) 
while ins_list.hasNext():           
    ins = ins_list.next()    
    ops = ins.getOpObjects(0)    
    try:        
        target_addr = ops[0]  
        sink_func = listing.getFunctionAt(target_addr) 
        sink_func_name = sink_func.getName()         
        if sink_func_name in sinks and sink_func_name not in  duplicate:
            duplicate.append(sink_func_name) 
            print (sink_func_name,target_addr) 
    except:
        pass    


Now that we have identified a list of sinks in our target binary, we have to locate where these functions are getting called. Since we are iterating through the executable section of the binary and checking every operand against the list of sinks, all we have to do is add a filter for the call instruction.

Adding this check to the previous code gives us the following:

sinks = [					
	"strcpy",
	"memcpy",
	"gets",
	"memmove",
	"scanf",
	"strcpyA", 
	"strcpyW", 
	"wcscpy", 
	"_tcscpy", 
	"_mbscpy", 
	"StrCpy", 
	"StrCpyA",
        "lstrcpyA",
        "lstrcpy", 
        #...
	]

duplicate = []
listing = currentProgram.getListing()
ins_list = listing.getInstructions(1)

#iterate through each instruction
while ins_list.hasNext():
    ins = ins_list.next()
    ops = ins.getOpObjects(0)
    mnemonic = ins.getMnemonicString()

    #check to see if the instruction is a call instruction
    if mnemonic == "CALL":
        try:
            target_addr = ops[0]
            sink_func = listing.getFunctionAt(target_addr)
            sink_func_name = sink_func.getName()
            #check to see if function being called is in the sinks list
            if sink_func_name in sinks and sink_func_name not in duplicate:
                duplicate.append(sink_func_name)
                print (sink_func_name,target_addr)
        except:
	        pass

Running the above script against CoreFTPServer v1.2 build 505 shows the results for all detected sinks:

ghidra_output8.png

Unfortunately, the above code does not detect any sinks in the CoreFTPServer binary. However, we know that this particular version of CoreFTPServer is vulnerable to a buffer overflow and contains the lstrcpyA sink. So, why did our plugin fail to detect any sinks?

After researching this question, we discovered that in order to identify the functions that are calling out to an external DLL, we need to use the function manager that specifically handles the external functions.

To do this, we modified our code so that every time we see a call instruction we go through all external functions in our program and check them against the list of sinks. Then, if they are found in the list, we verify whether that the operand matches the address of the sink.

The following is the modified section of the script:

sinks = [					
	"strcpy",
	"memcpy",
	"gets",
	"memmove",
	"scanf",
	"strcpyA", 
	"strcpyW", 
	"wcscpy", 
	"_tcscpy", 
	"_mbscpy", 
	"StrCpy", 
	"StrCpyA",
        "lstrcpyA",
        "lstrcpy", 
        #...
	]

program_sinks = {}
listing = currentProgram.getListing()
ins_list = listing.getInstructions(1)
ext_fm = fm.getExternalFunctions()

#iterate through each of the external functions to build a dictionary
#of external functions and their addresses
while ext_fm.hasNext():
    ext_func = ext_fm.next()
    target_func = ext_func.getName()
   
    #if the function is a sink then add it's address to a dictionary
    if target_func in sinks: 
        loc = ext_func.getExternalLocation()
        sink_addr = loc.getAddress()
        sink_func_name = loc.getLabel()
        program_sinks[sink_addr] = sink_func_name

#iterate through each instruction 
while ins_list.hasNext():
    ins = ins_list.next()
    ops = ins.getOpObjects(0)
    mnemonic = ins.getMnemonicString()

    #check to see if the instruction is a call instruction
    if mnemonic == "CALL":
        try:
            #get address of operand
            target_addr = ops[0]   
            #check to see if address exists in generated sink dictionary
            if program.sinks.get(target_addr):
                print (program_sinks[target_addr], target_addr,ins.getAddress()) 
        except:
            pass

Running the modified script against our program shows that we identified multiple sinks that could result in a buffer overflow.

ghidra_output9.png


Xrefs

The second and more efficient approach is to identify cross references to each sink and check which cross references are calling the sinks in our list. Because this approach does not search through the entire text section, it is more efficient.

Using the below code, we can identify cross references to each sink:


sinks = [					
	"strcpy",
	"memcpy",
	"gets",
	"memmove",
	"scanf",
	"strcpyA", 
	"strcpyW", 
	"wcscpy", 
	"_tcscpy", 
	"_mbscpy", 
	"StrCpy", 
	"StrCpyA",
        "lstrcpyA",
        "lstrcpy", 
        #...
	]

duplicate = []
func = getFirstFunction()

while func is not None:
    func_name = func.getName()
    
    #check if function name is in sinks list
    if func_name in sinks and func_name not in duplicate:
        duplicate.append(func_name)
        entry_point = func.getEntryPoint()
        references = getReferencesTo(entry_point)
	#print cross-references    
        print(references)
    #set the function to the next function
    func = getFunctionAfter(func)

Now that we have identified the cross references, we can get an instruction for each reference and add a filter for the call instruction. A final modification is added to include the use of the external function manager:

sinks = [					
	"strcpy",
	"memcpy",
	"gets",
	"memmove",
	"scanf",
	"strcpyA", 
	"strcpyW", 
	"wcscpy", 
	"_tcscpy", 
	"_mbscpy", 
	"StrCpy", 
	"StrCpyA",
        "lstrcpyA",
        "lstrcpy", 
        #...
	]

duplicate = []
fm = currentProgram.getFunctionManager()
ext_fm = fm.getExternalFunctions()

#iterate through each external function
while ext_fm.hasNext():
    ext_func = ext_fm.next()
    target_func = ext_func.getName()
    
    #check if the function is in our sinks list 
    if target_func in sinks and target_func not in duplicate:
        duplicate.append(target_func)
        loc = ext_func.getExternalLocation()
        sink_func_addr = loc.getAddress()    
        
        if sink_func_addr is None:
            sink_func_addr = ext_func.getEntryPoint()

        if sink_func_addr is not None:
            references = getReferencesTo(sink_func_addr)

            #iterate through all cross references to potential sink
            for ref in references:
                call_addr = ref.getFromAddress()
                ins = listing.getInstructionAt(call_addr)
                mnemonic = ins.getMnemonicString()

                #print the sink and address of the sink if 
                #the instruction is a call instruction
                if mnemonic == “CALL”:
                    print (target_func,sink_func_addr,call_addr)

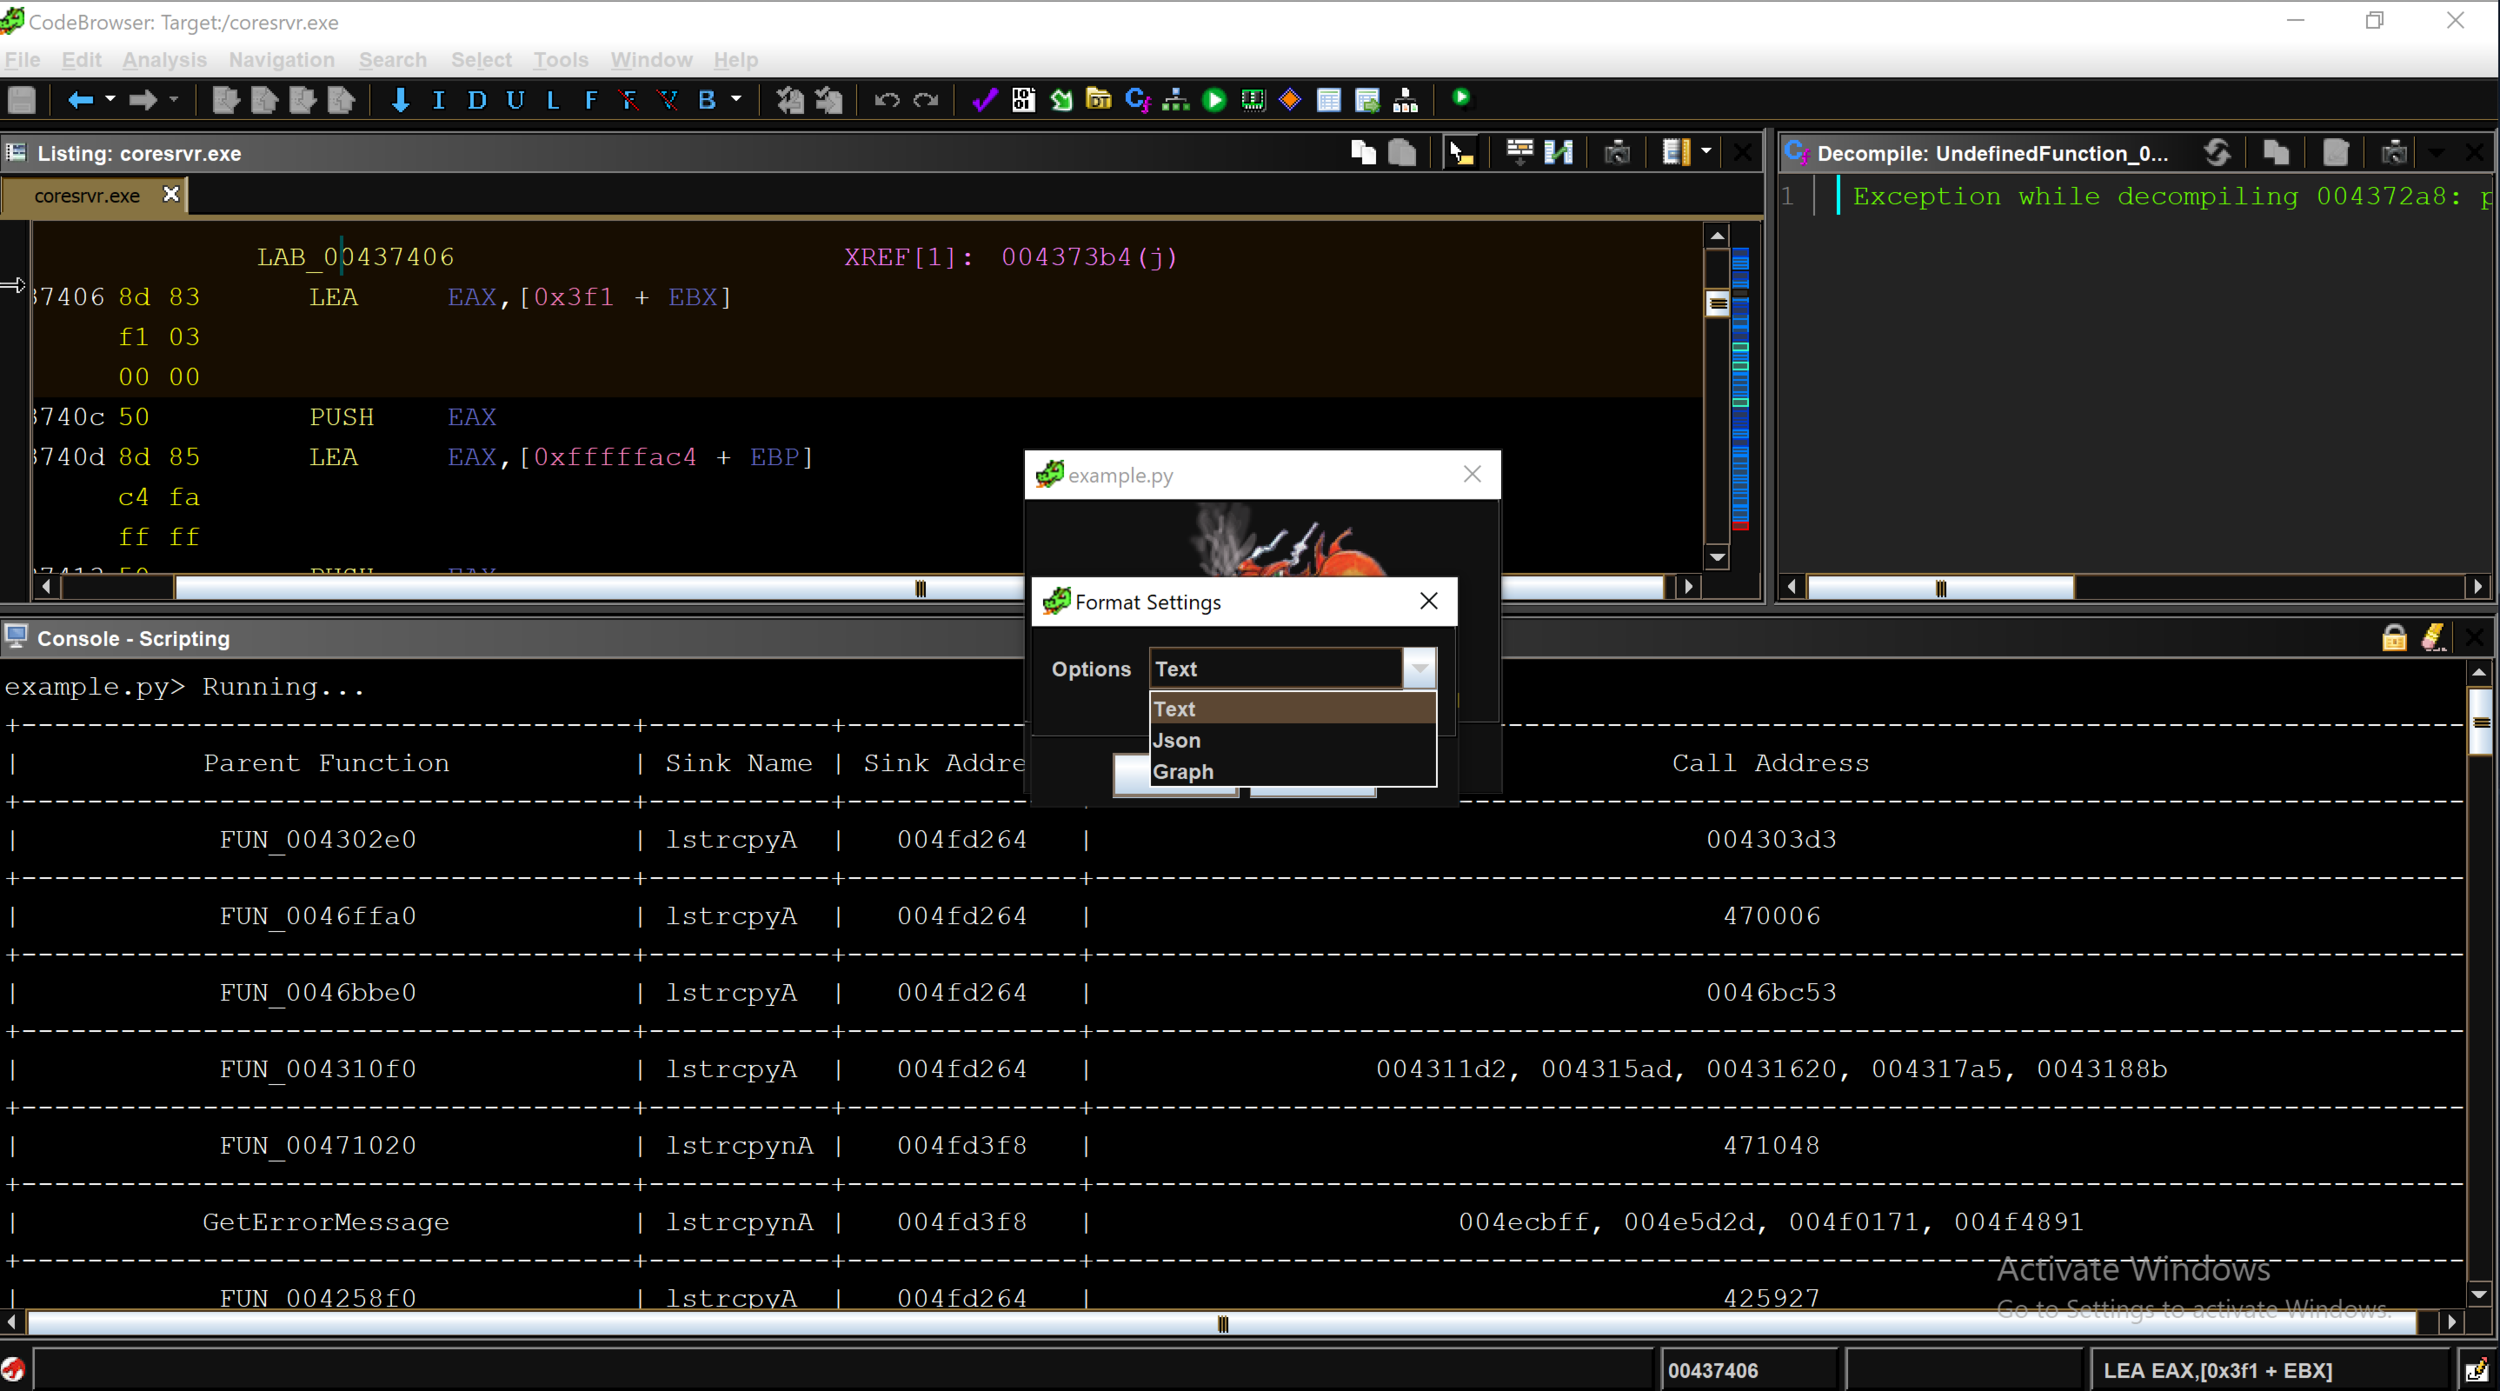
Running the modified script against CoreFTPServer gives us a list of sinks that could result in a buffer overflow:

ghidra_output9.png


Mapping Calling Functions to Sinks

So far, our Ghidra plugin can identify sinks. With this information, we can take it a step further by mapping the calling functions to the sinks. This allows security researchers to visualize the relationship between the sink and its incoming data. For the purpose of this post, we will use graphviz module to draw a graph.

Putting it all together gives us the following code:

from ghidra.program.model.address import Address
from ghidra.program.model.listing.CodeUnit import *
from ghidra.program.model.listing.Listing import *

import sys
import os

#get ghidra root directory
ghidra_default_dir = os.getcwd()

#get ghidra jython directory
jython_dir = os.path.join(ghidra_default_dir, "Ghidra", "Features", "Python", "lib", "Lib", "site-packages")

#insert jython directory into system path 
sys.path.insert(0,jython_dir)

from beautifultable import BeautifulTable
from graphviz import Digraph


sinks = [
    "strcpy",
    "memcpy",
    "gets",
    "memmove",
    "scanf",
    "strcpyA", 
    "strcpyW", 
    "wcscpy", 
    "_tcscpy", 
    "_mbscpy", 
    "StrCpy", 
    "StrCpyA", 
    "StrCpyW", 
    "lstrcpy", 
    "lstrcpyA", 
    "lstrcpyW", 
    #...
]

sink_dic = {}
duplicate = []
listing = currentProgram.getListing()
ins_list = listing.getInstructions(1)

#iterate over each instruction
while ins_list.hasNext():
    ins = ins_list.next()
    mnemonic = ins.getMnemonicString()
    ops = ins.getOpObjects(0)
    if mnemonic == "CALL":	
        try:
            target_addr = ops[0]
            func_name = None 
            
            if isinstance(target_addr,Address):
                code_unit = listing.getCodeUnitAt(target_addr)
                if code_unit is not None:
                    ref = code_unit.getExternalReference(0)	
                    if ref is not None:
                        func_name = ref.getLabel()
                    else:
                        func = listing.getFunctionAt(target_addr)
                        func_name = func.getName()

            #check if function name is in our sinks list
            if func_name in sinks and func_name not in duplicate:
                duplicate.append(func_name)
                references = getReferencesTo(target_addr)
                for ref in references:
                    call_addr = ref.getFromAddress()
                    sink_addr = ops[0]
                    parent_func_name = getFunctionBefore(call_addr).getName()

                    #check sink dictionary for parent function name
                    if sink_dic.get(parent_func_name):
                        if sink_dic[parent_func_name].get(func_name):
                            if call_addr not in sink_dic[parent_func_name][func_name]['call_address']:
                                sink_dic[parent_func_name][func_name]['call_address'].append(call_addr)
                            else:
                                sink_dic[parent_func_name] = 
                    else:	
                        sink_dic[parent_func_name] = 				
        except:
            pass

#instantiate graphiz
graph = Digraph("ReferenceTree")
graph.graph_attr['rankdir'] = 'LR'
duplicate = 0

#Add sinks and parent functions to a graph	
for parent_func_name,sink_func_list in sink_dic.items():
    #parent functions will be blue
    graph.node(parent_func_name,parent_func_name, style="filled",color="blue",fontcolor="white")
    for sink_name,sink_list in sink_func_list.items():
        #sinks will be colored red
        graph.node(sink_name,sink_name,style="filled", color="red",fontcolor="white")
        for call_addr in sink_list['call_address']:
	    if duplicate != call_addr:					
                graph.edge(parent_func_name,sink_name, label=call_addr.toString())
                duplicate = call_addr	

ghidra_default_path = os.getcwd()
graph_output_file = os.path.join(ghidra_default_path, "sink_and_caller.gv")

#create the graph and view it using graphiz
graph.render(graph_output_file,view=True)

Running the script against our program shows the following graph:

ghidra_output10.png

We can see the calling functions are highlighted in blue and the sink is highlighted in red. The addresses of the calling functions are displayed on the line pointing to the sink.

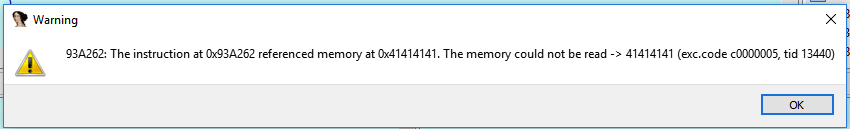
After conducting some manual analysis we were able to verify that several of the sinks identified by our Ghidra plugin produced a buffer overflow. The following screenshot of WinDBG shows that EIP is overwritten by 0x42424242 as a result of an lstrcpyA function call.  

ghidra_output15.png

Additional Features

Although visualizing the result in a graph format is helpful for vulnerability analysis, it would also be useful if the user could choose different output formats.

The Ghidra API provides several methods for interacting with a user and several ways of outputting data. We can leverage the Ghidra API to allow a user to choose an output format (e.g. text, JSON, graph) and display the result in the chosen format. The example below shows the dropdown menu with three different display formats. The full script is available at our github:

ghidra_output11.png

Limitations

There are multiple known issues with Ghidra, and one of the biggest issues for writing an analysis plugin like ours is that the Ghidra API does not always return the correct address of an identified standard function.

Unlike IDA Pro, which has a database of function signatures (FLIRT signatures) from multiple libraries that can be used to detect the standard function calls, Ghidra only comes with a few export files (similar to signature files) for DLLs.  Occasionally, the standard library detection will fail.

ghidra_output12.png

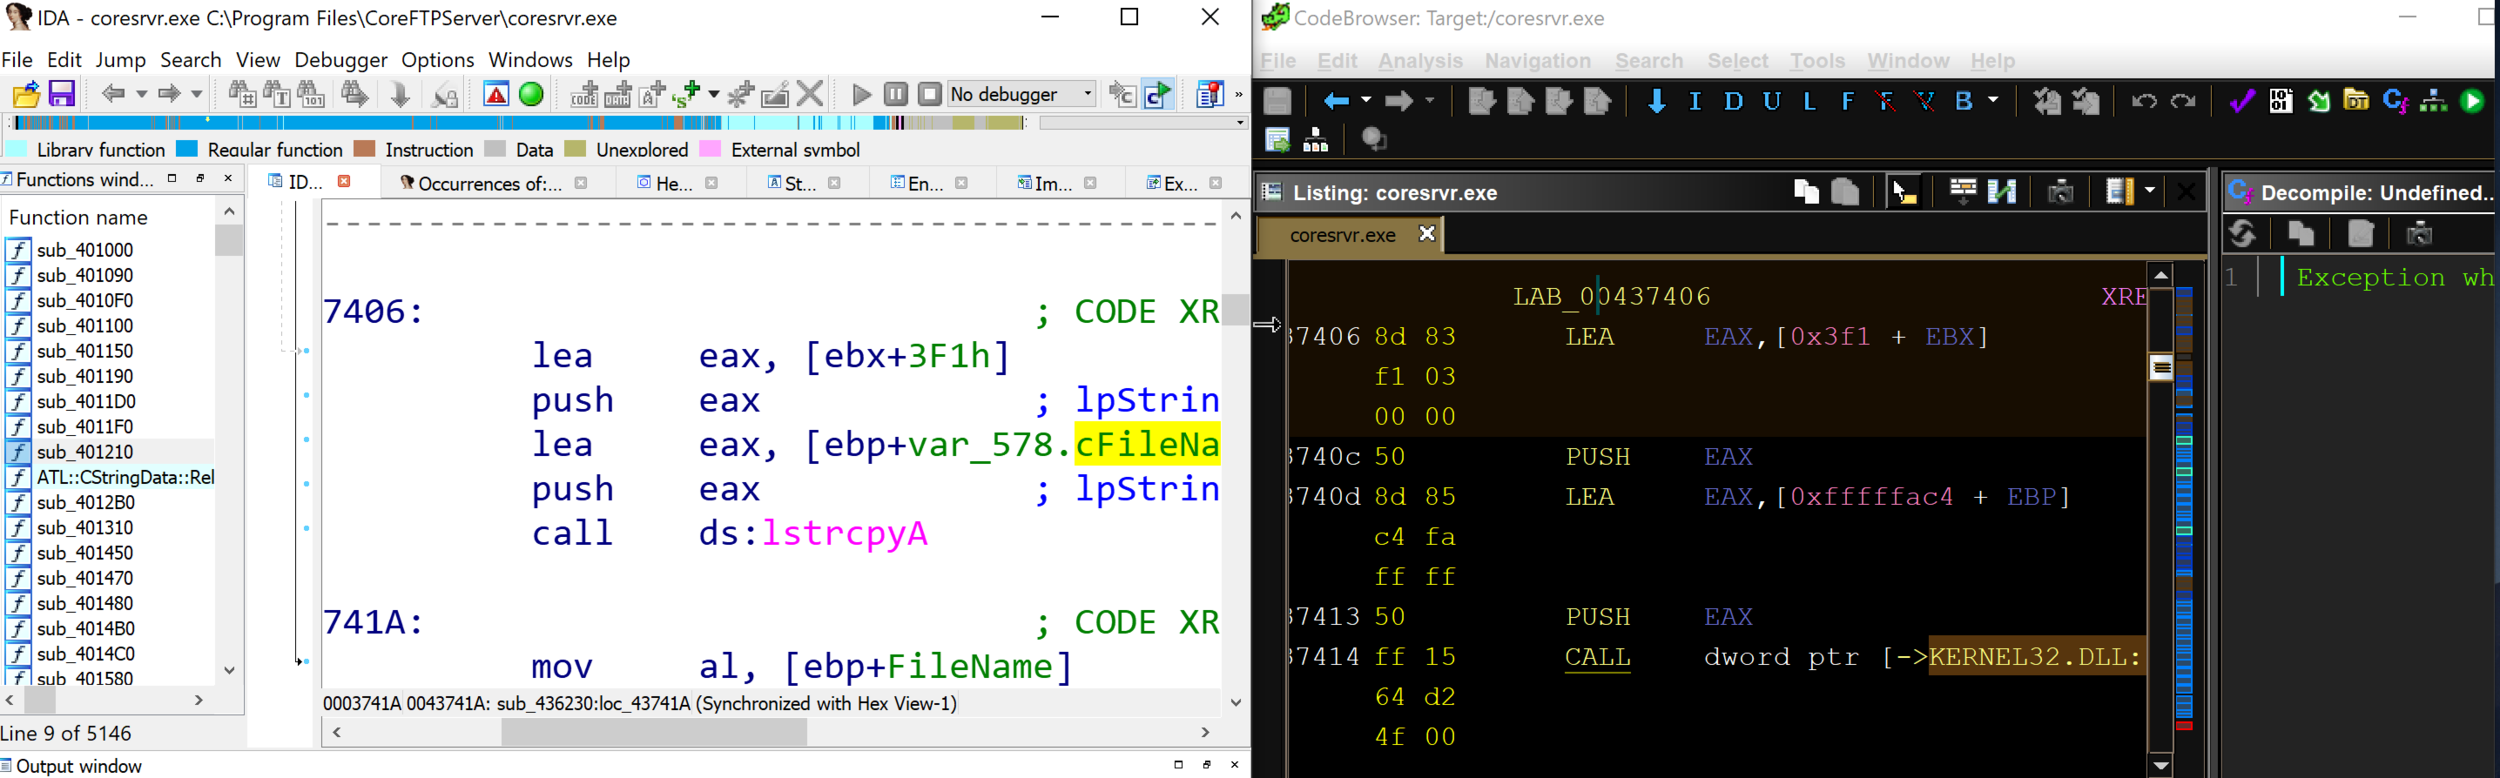
By comparing IDA Pro and Ghidra’s disassembly output of CoreFTPServer, we can see that IDA Pro’s analysis successfully identified and mapped the function lstrcpyA using a FLIRT signature, whereas Ghidra shows a call to the memory address of the function lstrcpyA.

Although the public release of Ghidra has limitations, we expect to see improvements that will enhance the standard library analysis and aid in automated vulnerability research.

Conclusion

Ghidra is a powerful reverse engineering tool that can be leveraged to identify potential vulnerabilities. Using Ghidra’s API, we were able to develop a plugin that identifies sinks and their parent functions and display the results in various formats. In our next blog post, we will conduct additional automated analysis using Ghidra and enhance the plugins vulnerability detection capabilities.

Introduction to IDAPython for Vulnerability Hunting - Part 2

Overview

In our last post we reviewed some basic techniques for hunting vulnerabilities in binaries using IDAPython. In this post we will expand upon that work and extend our IDAPython script to help detect a real Microsoft Office vulnerability that was recently found in the wild. The vulnerability that will be discussed is a remote code execution vulnerability that existed in the Microsoft Office EQNEDT32.exe component which was also known as the Microsoft Office Equation Editor. This program was in the news in January when, due to a number of discovered vulnerabilities. Microsoft completely removed the application (and all of its functionality) from Microsoft Office in a security update. The vulnerabilities that ended up resulting in Equation Editor being killed are of the exact type that we attempted to identify with the script written in the previous blog post. However, calls to strcpy in the Equation Editor application were optimized out and inlined by the compiler, rendering the script that we wrote previously ineffective at locating the vulnerable strcpy usages.

While the techniques that we reviewed in the previous post are useful in finding a wide range of dangerous function calls, there are certain situations where the script as written in the previous blog post will not detect the dangerous programming constructs that we intend and would expect it to detect. This most commonly occurs when compiler optimizations are used which replace function calls to string manipulation functions (such as strcpy and strcat) with inline assembly to improve program performance. Since this optimization removes the call instruction that we relied upon in our previous blog post, our previous detection method does not work in this scenario. In this post we will cover how to identify dangerous function calls even when the function call itself has been optimized out of the program and inlined.

Understanding the Inlined strcpy()

Before we are able to find and detect inlined calls to strcpy, we first need to understand what an inlined strcpy would look like. Let us take a look at an IDA Pro screenshot below that shows the disassembly view side-by-side with the HexRays decompiler output of an instance where a call to strcpy is inlined.

Example of inlined strcpy() - Disassembly on left, HexRays decompiled version on right

Example of inlined strcpy() - Disassembly on left, HexRays decompiled version on right

In the above screenshot we can observe that the decompiler output on the right side shows that a call to strcpy in made, but when we look to the left side disassembly there is not a corresponding call to strcpy. When looking for inlined string functions, a common feature of the inlined assembly to watch for is the use of the “repeat” assembly instructions (rep, repnz, repz) in performing the string operations. With this in mind, let’s dig into the disassembly to see what the compiler has used to replace strcpy in the disassembly above.


First, we observe the instruction at 0x411646: `repne scasb`. This instruction is commonly used to get the length of a string (and is often used when strlen() is inlined by the compiler). Looking at the arguments used to set up the `repne scasb` call we can see that it is getting the length of the string “arg_0”. Since performing a strcpy requires knowing the length of the source string (and consequently the number of bytes/characters to copy), this is typically the first step in performing a strcpy.


Next we continue down and see two similar looking instructions in `rep movsd` and `rep movsb`. These instructions copy a string located in the esi register into the edi register. The difference between these two instructions being the `rep movsd` instruction moves DWORDs from esi to edi, while `rep movsb` copies bytes. Both instructions repeat the copy instruction a number of times based upon the value in the ecx register.


Viewing the above code we can observe that the code uses the string length found by `repne scasb` instruction in order to determine the size of the string that is being copied. We can observe this by viewing seeing that following instruction 0x41164C the length of the string is stored in both eax and ecx. Prior to executing the `rep movsd` instruction we can see that ecx is shifted right by two. This results in only full DWORDs from the source string being copied to the destination. Next we observe that at instruction 0x41165A that the stored string length is moved back into ecx and then bitwise-AND’d with 3. This results in any remaining bytes that were not copied in the `rep movsd` instruction to be copied to the destination.  


Automating Vuln Hunting with the Inlined strcpy()

Now that we understand how the compiler optimized strcpy function calls we are able to enhance our vulnerability hunting scripts to allow us to find instances where they an inlined strcpy occurs. In order to help us do this, we will use the IDAPython API and the search functionality that it provides us with. Looking at the above section the primary instructions that are more or less unique to strcpy are the `rep movsd` with the `rep movsb` instruction following shortly thereafter to copy any remaining uncopied bytes.


So, using the IDAPython API to search for all instances of `rep movsd` followed by `rep movsb` 7 bytes after it gives us the following code snippet:


ea = 0
while ea != BADADDR:
   addr = FindText(ea+2,SEARCH_DOWN|SEARCH_NEXT, 0, 0, "rep movsd");
   ea = addr
   if "movsb" in GetDisasm(addr+7):
       print "strcpy found at 0x%X"%addr


If we run this against the EQNEDT32.exe, then we get the following output in IDA Pro:

Output of Script Against EQNEDT32.exe

Output of Script Against EQNEDT32.exe


If we begin to look at all of the instances where the script reports detected instances of inlined strcpy we find several instances where this script picks up other functions that are not strcpy but are similar. The most common function (other than strcpy) that this script detects is strcat(). Once we think about the similarities in functionality between those functions, it makes a lot of sense. Both strcat and strcpy are dangerous string copying functions that copy the entire length of a source string into a destination string regardless of the size of the destination buffer. Additionally, strcat introduces the same dangers as strcpy to an application, finding both with the same script is a way to kill two birds with one stone.


Now that we have code to find inlined strcpy and strcat in the code, we can add that together with our previous code in order to search specifically for inline strcpy and strcat that copy the data into stack buffers. This gives us the code snippet shown below:


# Check inline functions
info = idaapi.get_inf_structure()
ea = 0

while ea != BADADDR:
   addr = FindText(ea+2,SEARCH_DOWN|SEARCH_NEXT, 0, 0, "rep movsd");
   ea = addr
   _addr = ea

   if "movsb" in GetDisasm(addr+7):
       opnd = "edi" # Make variable based on architecture
       if info.is_64bit():
           opnd = "rdi"

      
       val = None
       function_head = GetFunctionAttr(_addr, idc.FUNCATTR_START)
       while True:
           _addr = idc.PrevHead(_addr)
           _op = GetMnem(_addr).lower()

           if _op in ("ret", "retn", "jmp", "b") or _addr < function_head:
               break

           elif _op == "lea" and GetOpnd(_addr, 0) == opnd:
               # We found the origin of the destination, check to see if it is in the stack
               if is_stack_buffer(_addr, 1):
                   print "0x%X"%_addr
                   break
               else: break

           elif _op == "mov" and GetOpnd(_addr, 0) == opnd:
               op_type = GetOpType(_addr, 1)

               if op_type == o_reg:
                   opnd = GetOpnd(_addr, 1)
                   addr = _addr
               else:
                   break

Running the above script and analyzing the results gives us a list of 32 locations in the code where a strcpy() or strcat() call was inlined by the compiler and used to copy a string into a stack buffer.


Improving Upon Previous Stack Buffer Check

Additionally, now that we have some additional experience with IDA Python, let us improve our previous scripts in order to write scripts that are compatible with all recent versions of IDA Pro. Having scripts that function on varying versions of the IDA API can be extremely useful as currently many IDA Pro users are still using IDA 6 API while many others have upgraded to the newer IDA 7.


When IDA 7 was released, it came with a large number of changes to the API that were not backwards compatible. As a result, we need to perform a bit of a hack in order to make our is_stack_buffer() function compatible with both IDA 6 and IDA 7 versions of the IDA Python API. To make matters worse, not only has IDA modified the get_stkvar() function signature between IDA 6 and IDA 7, it also appears that they introduced a bug (or removed functionality) so that the get_stkvar() function no longer automatically handles stack variables with negative offsets.


As a refresher, I have included the is_stack_buffer() function from the previous blog post below:

def is_stack_buffer(addr, idx):
   inst = DecodeInstruction(addr)
   return get_stkvar(inst[idx], inst[idx].addr) != None

First, we begin to introduce this functionality by adding a try-catch to surround our call to get_stkvar() as well as introduce a variable to hold the returned value from get_stkvar(). Since our previous blog post worked for the IDA 6 family API our “try” block will handle IDA 6 and will throw an exception causing us to handle the IDA 7 API within our “catch” block.


Now in order to properly handle the IDA 7 API, in the catch block for the we must pass an additional “instruction” argument to the get_stkvar() call as well as perform a check on the value of inst[idx].addr. We can think of “inst[idx].addr” as a signed integer that has been cast into an unsigned integer. Unfortunately, due to a bug in the IDA 7 API, get_stkvar() no longer performs the needed conversion of this value and, as a result, does not function properly on negative values of “inst[idx].addr” out of the box. This bug has been reported to the Hex-Rays team but, as of when this was written, has not been patched and requires us to convert negative numbers into the correct Python representation prior to passing them to the function. To do this we check to see if the signed bit of the value is set and, if it is, then we convert it to the proper negative representation using two’s complement.


def twos_compl(val, bits=32):
   """compute the 2's complement of int value val"""
   
   # if sign bit is set e.g., 8bit: 128-255 
   if (val & (1 << (bits - 1))) != 0: 
       val = val - (1 << bits)        # compute negative value

   return val                             # return positive value as is

   
def is_stack_buffer(addr, idx):
   inst = DecodeInstruction(addr)

   # IDA < 7.0
   try:
       ret = get_stkvar(inst[idx], inst[idx].addr) != None

   # IDA >= 7.0
   except:
       from ida_frame import *
       v = twos_compl(inst[idx].addr)
       ret = get_stkvar(inst, inst[idx], v)

   return ret


Microsoft Office Vulnerability

The Equation Editor application makes a great example program since it was until very recently, a widely distributed real-world application that we are able to use to test our IDAPython scripts. This application was an extremely attractive target for attackers since, in addition to it being widely distributed, it also lacks common exploit mitigations including DEP, ASLR, and stack cookies.


Running the IDAPython script that we have just written finds and flags a number of addresses including the address, 0x411658. Performing some further analysis reveals that this is the exact piece in the code that caused CVE-2017-11882, the initial remote code execution vulnerability found in Equation Editor.


Additionally, in the time that followed the public release of CVE-2017-11882, security researchers began to turn their focus to EQNEDT32.exe due to the creative work done by Microsoft to manually patch the assembly (which prompted rumors that Microsoft had somehow lost the source code to EQNEDT32.exe). This increased interest within the security community led to a number of additional vulnerabilities being subsequently found in EQNEDT32.exe (with most of them being stack-buffer overflows). These vulnerabilities include: CVE-2018-0802, CVE-2018-0804, CVE-2018-0805, CVE-2018-0806, CVE-2018-0807, CVE-2018-0845, and CVE-2018-0862. While there are relatively scarce details surrounding most of those vulnerabilities, given the results of the IDAPython scripting that we have performed, we should not be surprised that a number of additional vulnerabilities were found in this application.


Posted on November 20, 2018 .

Infecting the Embedded Supply Chain

NOTE: This blog post is based on our DEF CON talk with the same title. If you would like to view the slides from DEF CON, they can be viewed here. Demonstration videos will be posted soon.

Overview

As IoT devices continue to become more and more commonplace, new threats and attack vectors are introduced that must be considered. Embedded devices contain a variety of distinct surfaces that a determined attacker could target. One such attack vector that must be considered is the development supply chain. In developing an IoT device, a development team requires a variety of special components, tools, and debuggers. Any of these products could be targeted by an attacker to compromise the integrity of the device that is being developed. With that in mind, we analyze the security of the Segger J-Link Debug Probes. Hardware debuggers, such as the J-Link, are critical tools in assisting developers with building embedded devices. Segger claims that their J-Link devices are “the most widely used debug probes in the world."


J-Link Attack Surface

The Segger J-Link debug probes come with a variety of supporting software packages that are used in order to interact with the debug probes. Included in this software is:

  • Many user-mode applications

  • USB driver

  • Full Integrated Development Environment (IDE)

Analyzing the user-mode applications that were distributed with the J-Link revealed that many of the applications were missing binary protections which can assist in preventing the successful exploitation of vulnerabilities. The analysis of the binary protections revealed:

  • DEP/NX was enabled

  • ASLR was enabled

  • PIE was not enabled

  • Stack canaries were NOT present in *nix binaries, stack canaries were present in Windows

  • SafeSEH was used in Windows binaries
     

As we began to analyze the applications included with J-Link, we quickly identified a number of input vectors that these applications accepted. These input vectors included command line arguments, files, and network interfaces. With this information in mind, we began to examine the applications’ security.

Vulnerability Research

After identifying input vectors and getting a feel for the applications, we determined to move forward with security analysis through a combination of fuzzing and reverse engineering. As we began to further analyze these applications and began to compare the Linux and Windows versions of these packages we found that the majority of the code was cross-compiled. This made our lives easier as we knew that the functionality was nearly identical between the Windows and Linux versions of the application.


Additionally, we realized that much of the interesting application logic appeared to require traversing deep, complicated code paths to reach. As a result of this, we decided to use a generational fuzzing approach in order to attempt to achieve better fuzzing coverage of these hard to reach code paths. This method involved using knowledge of the binary gathered from reverse engineering in order to determine the structure of data that each respective application expects to receive and leads to the “interesting” code sections and then recreating that data structure within the context of our fuzzer’s data specification format.


Since we were planning to generationally fuzz both network and file formats we decided to use the Peach fuzzer. Peach allows us to define our data formats in a simple XML file format and includes support for all of the desired input vectors (networking, files, command line) out of the box.


We then developed several data format specifications (known in Peach as pit files) and began fuzzing various J-Link applications. We started seeing crashes right away, but we also began to have issues as the J-Link debug probes entered a bad state and were disconnected from the VM that we were using for fuzzing. This caused our fuzzing to halt as the applications that we were fuzzing require that a J-Link device be present as the applications require the device in order to properly execute.


In order to keep our J-Link attached to our VM we developed a custom crash monitor in order to ensure that the device was attached prior to executing any fuzzing iteration. The crash monitor is triggered on any crash that occurs while fuzzing and executes a user-specified set of actions. We wrote a custom script for the crash monitor to execute that utilized libvirt to check if the J-Link device was still attached to the VM and, if it was not attached, then reattach it. This allowed us to continue fuzzing the applications without issue.


Soon we were forced to halt our fuzzing efforts since we had observed so many crashes that we were running out of disk space due to the crash data stored by Peach. While triaging the crashes we noticed some interesting things about the crashes. First, we observed that a huge number of crashes were identical and were being automatically flagged as exploitable (thanks to !exploitable). These crashes made up such a large portion of our crashes that we received less coverage overall from our fuzzers than we had initially hoped for. Further analysis of our crashes revealed that, while we had built the data models to reach deep and interesting code paths, easy to trigger bugs that were located early in the execution path were causing crashes prior to reaching the code paths that we had initially targeted for security analysis.


Even though we received less coverage than we had hoped, we were still left with a variety of distinct crashes that appeared to be exploitable after some initial triage. With this information, we then attempted to see if we could fully exploit any of the issues that we had discovered.


Vulnerabilities Discovered

CVE-2018-9094 - Format String Vulnerability

One of the first vulnerabilities that we found was a format string vulnerability. This vulnerability can be demonstrated with a command line argument. Simply passing in a format specifier (such as “%p”) as part of the file name on the command line results in the format specifier to be formatted as such. We show this below with “fileName%p” in the command line being converted to “fileName00922C0F” in the output.

Format String Vulnerability Demonstration

Format String Vulnerability Demonstration

In the vulnerable application, JFlashSPI_CL.exe, we have a user controlled string which inserted into a larger log message string via sprintf. This log message string is then passed as the first argument into a “printf-style” function which accepts format specifiers. Hex-Rays decompiler output showing this vulnerable code snippet is shown below and clearly shows the vulnerability.

Hex-Rays Output of the Source of the Vulnerability

Hex-Rays Output of the Source of the Vulnerability

Further reversing reveals that the “custom_printf” function shown above is a logging function that is included in the J-Link applications. This function accepts a subset of the format specifiers that are accepted by printf and does not accept the “%n” family of specifiers that allow one to generate arbitrary writes via a format string vulnerability. With that being said, it is still possible to generate an arbitrary read with this code.


We can demonstrate this with the following command:

JFlashSPI_CL.exe -open xAAAA%X%X%X%X%X%X%X%X%X%X%X%X%X%X%X%X%X%X%X%X%X%X%X%X%X%X%X%s

Running this command results in an arbitrary read, in this case of the address 0x41414141 (or “AAAA”) and causes the following exception to be thrown:

Exception Thrown when Reading Memory "AAAA"

Exception Thrown when Reading Memory "AAAA"


CVE-2018-9095 - Command File Stack Buffer Overflow

Next, we analyzed the individual crash that made up a huge majority of our total crashes and caused us to eat up most of our VM’s disk space. This vulnerability is a traditional stack buffer overflow. In this vulnerability, we can overflow a stack buffer by including a line with 511 characters or more in a command file that is parsed by the JLinkExe application.


Since this application is compiled with NX protections in addition to ASLR, we are forced to bypass these in order to exploit this vulnerability and gain arbitrary code execution. In order to bypass the NX protections, we utilized ROP in order to perform all operations needed to gain execution. Using Ropper, we searched through the ROP gadgets that were present in JLinkExe in order to bypass ASLR and then gain execution. Since ASLR was enabled, we need to determine the address of libc and, subsequently, system(). Fortunately, we have enough gadgets present in JLinkExe in order to leak the address of libc.


We are able to leak the address of libc using a traditional GOT deference technique in which we dereference the GOT entry of some libc function and then utilize that dereferenced address in order to calculate the address of the desired function - in our case system() -  by performing arithmetic to add or subtract the static offset of our desired function from the dereferenced function.


This left us needing to pass an argument to system() in order to gain code execution. Since this vulnerability is triggered by a file that is local to the exploited system, we focused on just getting shell via this system rather than passing arbitrary, user-controlled payloads to it. This made finishing our exploitation somewhat simpler since we now just had to find a string to pass to the call to system in order to get our shell. However, since we were unable to send null bytes, we were limited with regards to which addresses we could pass as an argument to system. For example, our first thought was to use the “/bin/sh” string in the libc library, but the address of that string contains a null byte, forcing us to use a different address. As a result of that, we started focusing on strings in the valid address space and realized that we had a number of options to work with.


$ strings JLinkExe | grep "sh$"
fflush
SWOFlush
.gnu.hash


By pointing our argument to system() into the middle of a string that ended with “sh” we were able to execute the “sh” command as our argument to system(). This allows us to bypass the limitations on addresses and launches a shell for us, giving us the execution that we desired.

CVE-2018-9097 - Settings File Buffer Overflow

In the course of our fuzzing we found another buffer overrun caused by an input file JLinkExe. This vulnerability was caused by a buffer overrun in the BSS segment of a shared library that was used by the main executable. At this point, we could write an arbitrary number of non-null bytes into the BSS segment of the libjlinkarm.so.6.30.2, but we still needed some way to gain control of execution in the application in order to execute our code. Since we had the ability to overwrite arbitrary data into the BSS segment, we began to look into ways that we could turn that into code execution.


Using the IDA Sploiter plugin in IDA Pro, we searched for writable function pointers that we could overwrite. Fortunately, we were able to identify a number of overwritable function pointers following our overflowable buffer. After a little bit more research into those function pointers we were able to identify a function pointer that we could overwrite without causing the application to crash and would also get called soon after overwriting. With that, we were able to consistently redirect execution to a user-controlled location. At this point, we decided not to finish full exploitation on this vulnerability as and to instead focus more on the remote vulnerabilities that we had found. The reason for this was the similarity in the attack vector and impact of exploitation between this vulnerability and CVE-2018-9095.

CVE-2018-9096 - Telnet Stack Buffer Overflow

One interesting observation that we made when initially analyzing the applications that are included with the J-Link was that an application, JLinkRemoteServer, listens on a number of ports. Of particular interest to us was that the application listens on port 23.


$ sudo netstat -tulpn | grep JLinkRemote
tcp        0 0 0.0.0.0:24              0.0.0.0:* LISTEN 31417/./JLinkRemote
tcp        0 0 127.0.0.1:19080         0.0.0.0:* LISTEN 31417/./JLinkRemote
tcp        0 0 0.0.0.0:19020           0.0.0.0:* LISTEN 31417/./JLinkRemote
tcp        0 0 127.0.0.1:19021         0.0.0.0:* LISTEN 31417/./JLinkRemote
tcp        0 0 127.0.0.1:19030         0.0.0.0:* LISTEN 31417/./JLinkRemote
tcp        0 0 0.0.0.0:23              0.0.0.0:* LISTEN 31417/./JLinkRemote


Since port 23 is commonly used by telnet we decided to focus some of our reverse engineering efforts on this executable to determine what the purpose of this open port is. After beginning to look into this portion of the application in IDA Pro, we were quickly able to identify that this was, in fact, a Telnet server within the application.

Hex-Rays Output Showing the Creation of a Telnet Server Thread&nbsp;

Hex-Rays Output Showing the Creation of a Telnet Server Thread 

With this information, we configured our fuzzer to focus on the open ports with a special focus on the Telnet server as it appeared to have a large attack surface. Fuzzing the Telnet server revealed one interesting crash that appeared to be exploitable but was difficult for our team to reproduce. Additional analysis led us to discover that this was the result of a stack-buffer overflow. However, we were still unable to consistently trigger that crash. After further reversing of this application we were able to identify a race condition caused the application to either crash or continue running.


While we were unable to cause this crash to happen consistently, we were able to write an exploit which exploited this vulnerability in the instances where the race condition triggers the crash. In order to do this we followed a similar technique to what we used in the local stack buffer overflow exploit where we utilize a ROP chain in order to leak an address inside of libc through a GOT dereference and then use that leaked address to calculate the address of system().


Once we had the address of system() we wanted to develop a method for the exploit to execute an arbitrary, user-controlled command. While looking at the state of program memory during exploitation, we found that user-controlled data was also being stored in static locations in program memory. Due to the multithreaded nature of the JLinkRemoteServer application, the exact location where this data was stored in memory varied between two locations. Due to these locations being somewhat close to each other in memory, we attempted to develop a solution in order to allow our exploit to work consistently, regardless of which memory location the data was stored at.


While brainstorming potential solutions to this problem, we devised a solution using a clever trick. This trick is very similar to using a nop-sled. A nop-sled is when a shell-code payload is prepended with many nops or no-op instructions in order to increase the likelihood of executing the shellcode payload by allowing the application’s execution to be redirected anywhere into the nop-sled that was prepended to the payload and always execute the payload since the nop instructions are valid instructions which do not change the state of the application.


As we thought more about this technique, we began thinking about whether there was anything similar that we could prepend to our text-based command payload which would have the same effect. We immediately decided to try using spaces to prepend to our payload in order to try what we termed as a “space-sled”. Using this space-sled we prepend spaces to our command so that regardless of which location the user-controlled data was copied to, we would be able to point to the latter location in memory and land in a usable portion of the command string.  

CVE-2018-9093 - Tunnel Server Backdoor

Lastly, we have the J-Link tunnel server which effectively is a backdoor to J-Link devices via a Segger proxy server. The purpose of the tunnel server is to enable remote debugging of embedded devices, but, given that the tunnel server does not implement even the most basic of security measures, in doing so opens any J-Link device using this feature vulnerable to attack.


When the remote server runs with a J-Link device attached, the JLinkRemoteServer application registers the J-Link device serial number with the Segger tunnel server. In order to remotely access this remote device, a client must connect to the tunnel server and provide a serial number of the device that the client wishes to connect to.


Since serial numbers are 9 decimal digits, this means that there are 10 billion possible serial numbers. Assuming that valid serial numbers are randomly distributed throughout this space and the rate that we can check to see if a serial number is connected is 10 serial numbers/sec (this is about what we’ve seen in our testing) it would take over 31 years to check the entire serial number space. This seemed large enough that it would prove generally unfeasible for an attacker to brute force serial numbers on a large scale.


However, we realized that if we could shrink the space of serial numbers then we could potentially reduce the amount of time required to brute-force the space of serial numbers. In order to attempt to reduce the number of serial numbers that we needed to brute force, we began by trying to gather as much information on device models and serial numbers as we could. We did this by searching online for images of J-Link devices where we were able to read the device serial numbers from the images as well as gather the serial numbers from all of the devices that we had access to. Between these two methods we were able to gather around 30 J-Link serial numbers to analyze.


After reviewing these serial numbers we were able to detect several patterns in the way that Segger assigned J-Link serial numbers. The serial numbers seemed to be divided into three distinct sections: device model, device version, and an incremented device number.

Segger Serial Number Divided into Sections

Segger Serial Number Divided into Sections

With this information, we were able to reduce the serial number space required in order to get good coverage of J-Link serial numbers from the initial 10 billion to around 100,000. Using the same rate as above, that effectively reduces the time to brute from from over 31 years to less than 3 hours. This reduction in address space suddenly makes an attack on the Segger J-Link server much more appealing to an attacker.


Impact of Vulnerabilities

The vulnerabilities discovered are listed above in increasing level of severity. Below we discuss the impact of each of these vulnerabilities and explain the potential impact of an attacker exploiting each vulnerability.


The first vulnerability, CVE-2018-9094, is not able to be used to gain code execution due to the custom format string functions that are in use and, even if it were, would be a lower severity simply due to the input vector (the command line) that is used to exploit that vulnerability.


Next up, we have CVE-2018-9095 and CVE-2018-9097. These two vulnerabilities involve malicious files and result in gaining code execution when a malicious file is opened by a J-Link application. These are more severe since malicious files are a common attack vector and are able to be spread via email or any other file transfer mechanism. An attacker could use one of these vulnerabilities to attempt to gain access to the a system by getting an unwitting user to open a malicious file in a vulnerable application. As a result, these vulnerabilities are a high severity, but exploitation still relies on a user opening an untrusted file.


CVE-2018-9096 is our first remote exploit. This exploit allows a user to gain code execution on a system remotely and without any interaction from the victim. This is a critical vulnerability as it allows an attacker to spread throughout a network to any machine that is running the vulnerable application.


Lastly, we have CVE-2018-9093. This vulnerability is perhaps the most severe of these vulnerabilities. This vulnerability allows attackers to gain access into a network, bypassing firewalls and other security systems to gain access inside a network. Once inside the network with this vulnerability an attacker could read or write the firmware of any devices attached to the remote J-Link. To make matters worse, this vulnerability simply requires knowledge of the Segger J-Link serial number scheme and a small bit of reverse engineering to discover the hardcoded “magic numbers” that Segger uses in order to make a connection to via their tunnel server.

Disclosure

Following this research, we disclosed these vulnerabilities to Segger on April 4, 2018. They were acknowledged by Segger shortly later and we have seen many of these issues patched in several of the subsequent releases of the J-Link software.

Conclusion/Takeaways

As we have previously demonstrated with our security research into Hello Barbie and Election Safe Locks, many embedded devices have severe security flaws. With that being said, if you are a developer or device manufacturer who is attempting to build a secure device it is important to consider your supply chain. As we have shown here, important elements of the device development process oftentimes contain vulnerabilities that could compromise the integrity of a device that is being developed as well as the entire network.


Posted on August 11, 2018 .

Game Hacking: Hammerwatch Invincibility

Hacking video games poses interesting challenges that sit outside the realm of traditional vulnerability research and exploit development. It requires a different perspective that aims to solve a set of goals that rely heavily on reverse engineering and shares similar techniques to that of malware analysis. However unlike traditional exploit development, when you hack a video game it provides immediate visual feedback.


At Somerset Recon, we find value in researching this form of hacking. While it is a bit esoteric, in the end it is still hunting for vulnerabilities in software. Additionally, much of the software in video games shares similarities to the software we regularly perform security assessments on. These similarities include utilizing custom protocols, assuming trust in the client,  and using an architecture built upon legacy software/architecture with features bolted on, etc.


Hammerwatch is one game that encompasses all these elements. It is a top down multiplayer “hack-and-slash” dungeon-crawler that draws direct inspiration from the classic arcade game Gauntlet. The multiplayer gameplay uses a client-server architecture. When starting a multiplayer session a user hosts a game and other clients connect to that user’s game session. Our goal here was to unlock or create abilities in Hammerwatch that the game was not intended to have, to have those newly created abilities work in multiplayer, and to attempt do it all with style.


During our research, we quickly discovered that Hammerwatch had a very loose client-server model. Using the memory editor in Cheat Engine, we were able to set our health value and the server respected the change. This led us to believe that the client was responsible for updating the server of changes and that these changes were not double-checked by the server.


Our next steps were to reverse the codebase to observe what values in the game we could change. Since Hammerwatch is written on Mono, decompiling it with a .NET decompiler gives us the full C# codebase. We used dnSpy for this task. Loading the Hammerwatch.exe executable results in a tree-view which nicely displays all the classes in the game, including the character classes.


Dnspy Provides the Full Decompiled Source

Dnspy Provides the Full Decompiled Source

After reviewing the classes, we noted that the ranger character looked interesting, so we decided to focus our efforts on modifying the Ranger class. The Ranger class is extended by a subclass, PlayerRangerActorBehavior, that contains the properties and behaviors of our Ranger character. This subclass contains a function called "Damaged" that controls how the client calculates and reports damage to the world.


public override bool Damaged(WorldObject attacker, int dmg, IBuff buff, bool canKill)
{
   if (EnemyHiveMind.Random.NextDouble() < (double)this.dodgeChance)
   {
       this.dodgeEffectColor = 1f;
       this.dodgeSnd.Play3D(this.actor.Position, false, -1f);
       Network.SendToAll("RangerDodged", new object[0]);
       return false;
   }
   return base.Damaged(attacker, dmg, buff, canKill);
}


Most of the work is done in the base class, but the ranger can randomly dodge attacks depending on a random number generator. However, an invincibility cheat can be achieved simply by patching the dodge chance check to always return false.


public override bool Damaged(WorldObject attacker, int dmg, IBuff buff, bool canKill)
{
   this.dodgeEffectColor = 1f;
   this.dodgeSnd.Play3D(this.actor.Position, false, -1f);
   Network.SendToAll("RangerDodged", new object[0]);
   return false;
}


Invincibility Cheat in Effect. Left-side is what the cheater sees, and the Right-side is what the other players see

Invincibility Cheat in Effect. Left-side is what the cheater sees, and the Right-side is what the other players see


Success! The client is dodging all damage indicated by the character blinking, and those dodges are then propagated to the server.


More interesting cheats can be achieved when observing the ranger classes Attack function. This function works by starting some animations, calling ShootArrow in the direction the character is facing, and updating the world about this action.


public override void Attack(WorldActor actor)
{
   this.attacking = 1;
   this.attacking = this.Sprite.Length;
   this.Sprite.Reset();
   this.attackSnd.Play3D(actor.Position, false, -1f);
   this.ShootArrow(this.lookDir);
   Network.SendToAll("PlayerAttack", new object[]
   {
       this.lookDir
   });
}


By replacing the above call to ShootArrow and replacing it with a custom function, we are able to modify the default shoot arrow attack with a custom attack. This attack shoots multiple arrows in a perfect circle around the player, named appropriately as “RainingDeath”.


public void RainingDeath(int numOfArrows)
{
   for (int arrow = 0; arrow < numOfArrows; arrow++)
   {
       float angle = 6.28318548f / (float)numOfArrows * (float)arrow;
       Vector2 newDirection = new Vector2((float)Math.Cos((double)angle), (float)Math.Sin((double)angle));
       ShootArrow(newDirection);
   }
}
RainingDeath Custom Attack in Effect -&nbsp;Left-side is what the cheater sees,&nbsp;Right-side is what the other players see

RainingDeath Custom Attack in Effect - Left-side is what the cheater sees, Right-side is what the other players see

The most interesting part about this cheat is the effect it has on the host and other clients. The other players do not render the “RainingDeath” animations, but they do process the damage to enemies correctly. While it seems odd, it makes perfect sense when you take a look at the how the game handles creature damage. In BaseCreature class, the Damaged function is the handler that’s called when an enemy takes damage. The function is large, but the interesting bits are the Network.SendToAll function calls.


public override bool Damaged(WorldObject attacker, int dmg, IBuff buff, bool canKill)
{
   …………
   if (base.Health <= 0f)
   {
       this.dead = true;
       if (buff != null && this.HasHitEffect(buff.EffectId))
       {
           Network.SendToAll("UnitDiedWithHitEffect", new object[]
           {
               this.actor.NodeId,
               buff.EffectId
           });
       }
       else
       {
           Network.SendToAll("UnitDied", new object[]
           {
               this.actor.NodeId
           });
       }
   }
   …
}

The SendToAll function sends a set of predefined commands to all connected players, including the host, and it is easily abused. While our previous modifications have been focused on modifying our local behavior and seeing if it would propagate to the server, it’s clear that all we had to do was issue “UnitDied” commands repeatedly until there was no one left.


Our analysis of Hammerwatch revealed that it does not implement robust client-server protections and anti-cheating measures. If the game’s authors had made a few design decisions differently these cheats would not be possible. Specifically, creating a mechanism for the server would verify the integrity of a client’s game binary to make sure it has not been tampered with before allowing it to connect, or modifying the client-server model so that only the server were able to receive action updates, keep track of creatures damage, and enforce rules.


While these issues may seem specific to Hammerwatch, they actually extend past this. In our experience, issues that we encounter in game hacking such as custom protocols with similar weaknesses of assuming trust or not properly verifying the sender, are common in software today. All of this combined to make our work with Hammerwatch a good lesson in security as well as a fun game to hack.


The End Result:&nbsp;Playing Hammerwatch using Invincibility Mode, Unlimited Mana Mode, and a Custom Multi-Arrow Spin Attack

The End Result: Playing Hammerwatch using Invincibility Mode, Unlimited Mana Mode, and a Custom Multi-Arrow Spin Attack

Posted on July 30, 2018 .

Introduction to IDAPython for Vulnerability Hunting

Overview

IDAPython is a powerful tool that can be used to automate tedious or complicated reverse engineering tasks. While much has been written about using IDAPython to simplify basic reversing tasks, little has been written about using IDAPython to assist in auditing binaries for vulnerabilities. Since this is not a new idea (Halvar Flake presented on automating vulnerability research with IDA scripting in 2001), it is a bit surprising that there is not more written on this topic. This may be partially a result of the increasing complexity required to perform exploitation on modern operating systems. However, there is still a lot of value in being able to automate portions of the vulnerability research process.

In this post we will begin to describe using basic IDAPython techniques to detect dangerous programming constructs which often result in stack-buffer overflows. Throughout this blog post, I will be walking through automating the detection of a basic stack-buffer overflow using the “ascii_easy” binary from http://pwnable.kr. While this binary is small enough to manually reverse in its entirety, it serves as a good educational example whereby the same IDAPython techniques can be applied to much larger and more complex binaries.

Getting Started

Before we start writing any IDAPython, we must first determine what we would like our scripts to look for. In this case, I have selected a binary with one of the most simple types of vulnerabilities, a stack-buffer overflow caused by using `strcpy` to copy a user-controlled string into a stack-buffer. Now that we know what we are looking for, we can begin to think about how to automate finding these types of vulnerabilities.

For our purposes here, we will break this down into two steps:

1. Locating all function calls that may cause the stack-buffer overflow (in this case `strcpy`)
2. Analyzing usages of function calls to determine whether a usage is “interesting” (likely to cause an exploitable overflow)

Locating Function Calls

In order to find all calls to the `strcpy` function, we must first locate the `strcpy` function itself. This is easy to do with the functionality provided by the IDAPython API. Using the code snippet below we can print all function names in the binary:

for functionAddr in Functions():    
   print(GetFunctionName(functionAddr))

Running this IDAPython script on the ascii_easy binary gives us the following output. We can see that all of the function names were printed in the output window of IDA Pro.  

vrblog_fig1_get_func_names.png

Next, we add code to filter through the list of functions in order to find the `strcpy` function that is of interest to us. Using simple string comparisons will do the trick here. Since we oftentimes deal with functions that are similar, but slightly differing names (such as `strcpy` vs `_strcpy` in the example program) due to how imported functions are named, it is best to check for substrings rather than exact strings.

Building upon our previous snippet, we now have the following code:

for functionAddr in Functions():    
    if “strcpy” in GetFunctionName(functionAddr):        
        print hex(functionAddr)

Now that we have the function that we are interested in, we have to identify all locations where it is called. This involves a couple of steps. First we get all cross-references to `strcpy` and then we check each cross-reference to find which cross references are actual `strcpy` function calls. Putting this all together gives us the piece of code below:

for functionAddr in Functions():    
    # Check each function to look for strcpy        
    if "strcpy" in GetFunctionName(functionAddr): 
        xrefs = CodeRefsTo(functionAddr, False)                
        # Iterate over each cross-reference
        for xref in xrefs:                            
            # Check to see if this cross-reference is a function call                            
            if GetMnem(xref).lower() == "call":           
                print hex(xref)

Running this against the ascii_easy binary yields all calls of `strcpy` in the binary. The result is shown below:

vrblog_fig2_strcpy_calls.png

Analysis of Function Calls

Now, with the above code, we know how to get the addresses of all calls to `strcpy` in a program. While in the case of the ascii_easy application there is only a single call to `strcpy` (which also happens to be vulnerable), many applications will have a large number of calls to `strcpy` (with a large number not being vulnerable) so we need some way to analyze calls to `strcpy` in order to prioritize function calls that are more likely to be vulnerable.

One common feature of exploitable buffers overflows is that they oftentimes involve stack buffers. While exploiting buffer overflows in the heap and elsewhere is possible, stack-buffer overflows represent a simpler exploitation path.

This involves a bit of analysis of the destination argument to the strcpy function. We know that the destination argument is the first argument to the strcpy function and we are able to find this argument by going backwards through the disassembly from the function call. The disassembly of the call to strcpy is included below.

vrblog_fig3_function_call.png

In analyzing the above code, there are two ways that one might find the destination argument to the _strcpy function. The first method would be to rely on the automatic IDA Pro analysis which automatically annotates known function arguments. As we can see in the above screenshot, IDA Pro has automatically detected the “dest” argument to the _strcpy function and has marked it as such with a comment at the instruction where the argument is pushed onto the stack.

Another simple way to detect arguments to the function would be to move backwards through the assembly, starting at the function call looking for “push” instructions. Each time we find an instruction, we can increment a counter until we locate the index of the argument that we are looking for. In this case, since we are looking for the “dest” argument that happens to be the first argument, this method would halt at the first instance of a “push” instruction prior to the function call.

In both of these cases, while we are traversing backwards through the code, we are forced to be careful to identify certain instructions that break sequential code flow. Instructions such as “ret” and “jmp” cause changes in the code flow that make it difficult to accurately identify the arguments. Additionally, we must also make sure that we don’t traverse backwards through the code past the start of the function that we are currently in. For now, we will simply work to identify instances of non-sequential code flow while searching for the arguments and halt the search if any instances of non-sequential code flow is found.

We will use the second method of finding arguments (looking for arguments being pushed to the stack). In order to assist us in finding arguments in this way, we should create a helper function. This function will work backwards from the address of a function call, tracking the arguments pushed to the stack and return the operand corresponding to our specified argument.

So for the above example of the call to _strcpy in  ascii_easy, our helper function will return the value “eax” since the “eax” register stores the destination argument of strcpy when it is pushed to the stack as an argument to _strcpy. Using some basic python in conjunction with the IDAPython API, we are able to build a function that does that as shown below.

def find_arg(addr, arg_num):
   # Get the start address of the function that we are in
   function_head = GetFunctionAttr(addr, idc.FUNCATTR_START)    
   steps = 0
   arg_count = 0
   # It is unlikely the arguments are 100 instructions away, include this as a safety check
   while steps < 100:    
       steps = steps + 1
       # Get the previous instruction
       addr = idc.PrevHead(addr)  
       # Get the name of the previous instruction
       op = GetMnem(addr).lower()         
       # Check to ensure that we haven’t reached anything that breaks sequential code flow        
       if op in ("ret", "retn", "jmp", "b") or addr < function_head:
           return
       if op == "push":
           arg_count = arg_count + 1
           if arg_count == arg_num:
               # Return the operand that was pushed to the stack
               return GetOpnd(addr, 0) 

Using this helper function we are able to determine that the “eax” register was used to store the destination argument prior to calling _strcpy. In order to determine whether eax is pointing to a stack buffer when it is pushed to the stack we must now continue to try to track where the value in “eax” came from. In order to do this, we use a similar search loop to that which we used in our previous helper function:

# Assume _addr is the address of the call to _strcpy 
# Assume opnd is “eax” 
# Find the start address of the function that we are searching in
function_head = GetFunctionAttr(_addr, idc.FUNCATTR_START)
addr = _addr 
while True:
   _addr = idc.PrevHead(_addr)
   _op = GetMnem(_addr).lower()    
   if _op in ("ret", "retn", "jmp", "b") or _addr < function_head:
       break
   elif _op == "lea" and GetOpnd(_addr, 0) == opnd:
       # We found the destination buffer, check to see if it is in the stack
       if is_stack_buffer(_addr, 1):
           print "STACK BUFFER STRCOPY FOUND at 0x%X" % addr
           break
   # If we detect that the register that we are trying to locate comes from some other register
   # then we update our loop to begin looking for the source of the data in that other register
   elif _op == "mov" and GetOpnd(_addr, 0) == opnd:
       op_type = GetOpType(_addr, 1)
       if op_type == o_reg:
           opnd = GetOpnd(_addr, 1)
           addr = _addr
       else:
           break

In the above code we perform a backwards search through the assembly looking for instructions where the register that holds the destination buffer gets its value. The code also performs a number of other checks such as checking to ensure that we haven’t searched past the start of the function or hit any instructions that would cause a change in the code flow. The code also attempts to trace back the value of any other registers that may have been the source of the register that we were originally searching for. For example, this code attempts to account for the situation demonstrated below.

... 
lea ebx [ebp-0x24] 
... 
mov eax, ebx
...
push eax
...

Additionally, in the above code, we reference the function is_stack_buffer(). This function is one of the last pieces of this script and something that is not defined in the IDA API. This is an additional helper function that we will write in order to assist us with our bug hunting. The purpose of this function is quite simple: given the address of an instruction and an index of an operand, report whether the variable is a stack buffer. While the IDA API doesn’t provide us with this functionality directly, it does provide us with the ability to check this through other means. Using the get_stkvar function and checking whether the result is None or an object, we are able to effectively check whether an operand is a stack variable. We can see our helper function in the code below:

def is_stack_buffer(addr, idx):
   inst = DecodeInstruction(addr)
   return get_stkvar(inst[idx], inst[idx].addr) != None

Note that the above helper function is not compatible with the IDA 7 API. In our next blog post we will present a new method of checking whether an argument is a stack buffer while maintaining compatibility with all recent versions of the IDA API.

So now we can put all of this together into a nice script as shown below in order to find all of the instances of strcpy being used in order to copy data into a stack buffer. With these skills it is possible for us to extend these capabilities beyond just strcpy but also to similar functions such as strcat, sprintf, etc. (see the Microsoft Banned Functions List for inspiration) as well as to adding additional analysis to our script. The script is included  in its entirety at the bottom of the post. Running the script results in our successfully finding the vulnerable strcpy as shown below.

vrblog_fig4_output.png

Script

def is_stack_buffer(addr, idx):
   inst = DecodeInstruction(addr)
   return get_stkvar(inst[idx], inst[idx].addr) != None 

def find_arg(addr, arg_num):
   # Get the start address of the function that we are in
   function_head = GetFunctionAttr(addr, idc.FUNCATTR_START)    
   steps = 0
   arg_count = 0
   # It is unlikely the arguments are 100 instructions away, include this as a safety check
   while steps < 100:    
       steps = steps + 1
       # Get the previous instruction
       addr = idc.PrevHead(addr)  
       # Get the name of the previous instruction        
       op = GetMnem(addr).lower() 
       # Check to ensure that we havent reached anything that breaks sequential code flow        
       if op in ("ret", "retn", "jmp", "b") or addr < function_head:            
           return
       if op == "push":
           arg_count = arg_count + 1
           if arg_count == arg_num:
               #Return the operand that was pushed to the stack 
               return GetOpnd(addr, 0) 

for functionAddr in Functions():
   # Check each function to look for strcpy
   if "strcpy" in GetFunctionName(functionAddr): 
       xrefs = CodeRefsTo(functionAddr, False)
       # Iterate over each cross-reference
       for xref in xrefs:
           # Check to see if this cross-reference is a function call
           if GetMnem(xref).lower() == "call":
               # Since the dest is the first argument of strcpy
               opnd = find_arg(xref, 1) 
               function_head = GetFunctionAttr(xref, idc.FUNCATTR_START)
               addr = xref
               _addr = xref                
               while True:
                   _addr = idc.PrevHead(_addr)
                   _op = GetMnem(_addr).lower()                    
                   if _op in ("ret", "retn", "jmp", "b") or _addr < function_head:
                       break
                   elif _op == "lea" and GetOpnd(_addr, 0) == opnd:
                       # We found the destination buffer, check to see if it is in the stack
                       if is_stack_buffer(_addr, 1):
                           print "STACK BUFFER STRCOPY FOUND at 0x%X" % addr                            break
                   # If we detect that the register that we are trying to locate comes from some other register
                   # then we update our loop to begin looking for the source of the data in that other register
                   elif _op == "mov" and GetOpnd(_addr, 0) == opnd:
                       op_type = GetOpType(_addr, 1)
                       if op_type == o_reg:
                           opnd = GetOpnd(_addr, 1)
                           addr = _addr
                       else:
                           break
Posted on July 11, 2018 .